AAChartKit
 AAChartKit copied to clipboard
📈📊🚀🚀🚀An elegant modern declarative data visualization chart framework for iOS, iPadOS and macOS. Extremely powerful, supports line, spline, area, areaspline, column, bar, pie, scatter, angular ga...
 像这样
如何隐藏滚动条

当我尝试用AAScrollablePlotArea使其可以横向滚动后,发现多了个滚动条。 请问如何隐藏这个滚动条? 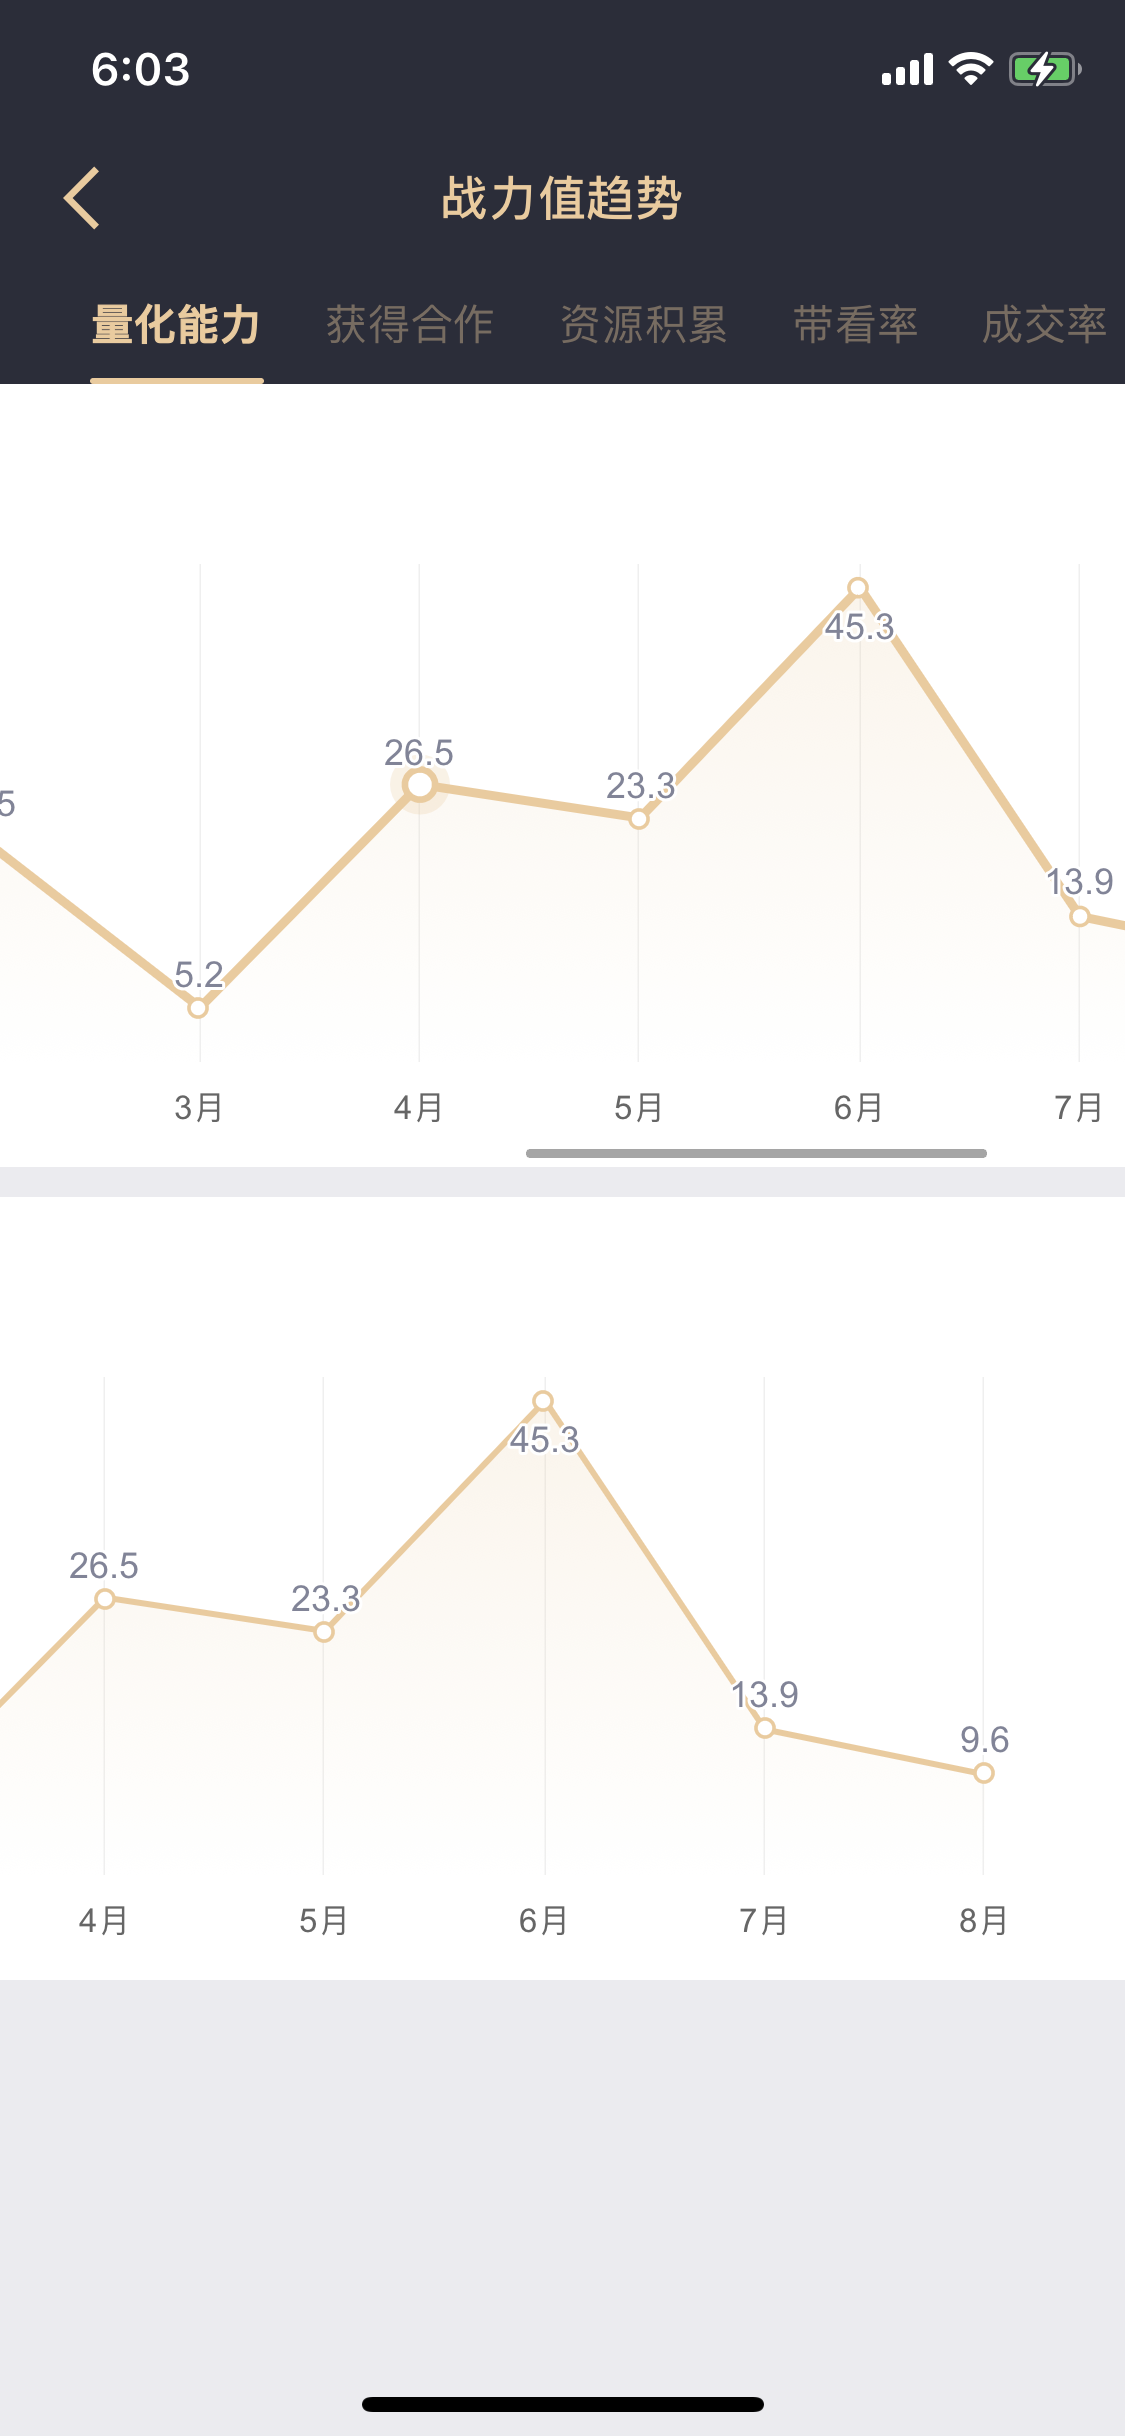
如图 我想将datalabel的金额改成有千分位 options.plotOptions.pie.dataLabels.format = @"{point.name} {point.y:.0f}({point.percentage:.2f}%)";
https://data.jianshukeji.com/index.html 首页 https://jshare.com.cn/highmaps/FSSm7A 示例 数据是 https://data.jianshukeji.com/geochina/beijing.js
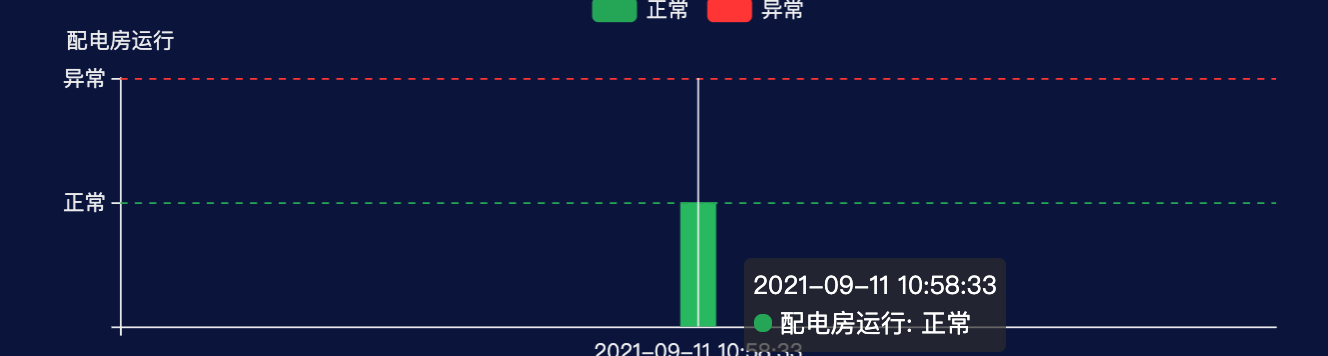
您好!1.如何将x轴放在图表上方?2.如何改变图表x轴,以时间方式显示 3.如何实现一条基准线,滑动视图时显示数据。 谢谢,望请告知。
i want to use the following formats for axis and series. can i use? if so how? 2021-10-25 - date format
Metadata
Owner
Metadata
📈📊🚀🚀🚀An elegant modern declarative data visualization chart framework for iOS, iPadOS and macOS. Extremely powerful, supports line, spline, area, areaspline, column, bar, pie, scatter, angular ga...