AAChartKit
 AAChartKit copied to clipboard
📈📊🚀🚀🚀An elegant modern declarative data visualization chart framework for iOS, iPadOS and macOS. Extremely powerful, supports line, spline, area, areaspline, column, bar, pie, scatter, angular ga...

我在 demo 六边形(configureTriangleRadarChart/configureHexagonRadarChart)的基础上做了更改使用图片作为 X 轴 Label 时,仅有一半的label会显示图片, 五边形显示 3 个图 八边形显示 4 个图 polar 属性设置为 false 可全部显示,但是就不是雷达图了 麻烦 AnAn 看一下有没有办法在雷达图的情况下使用图片作为 x轴 label 并全部显示 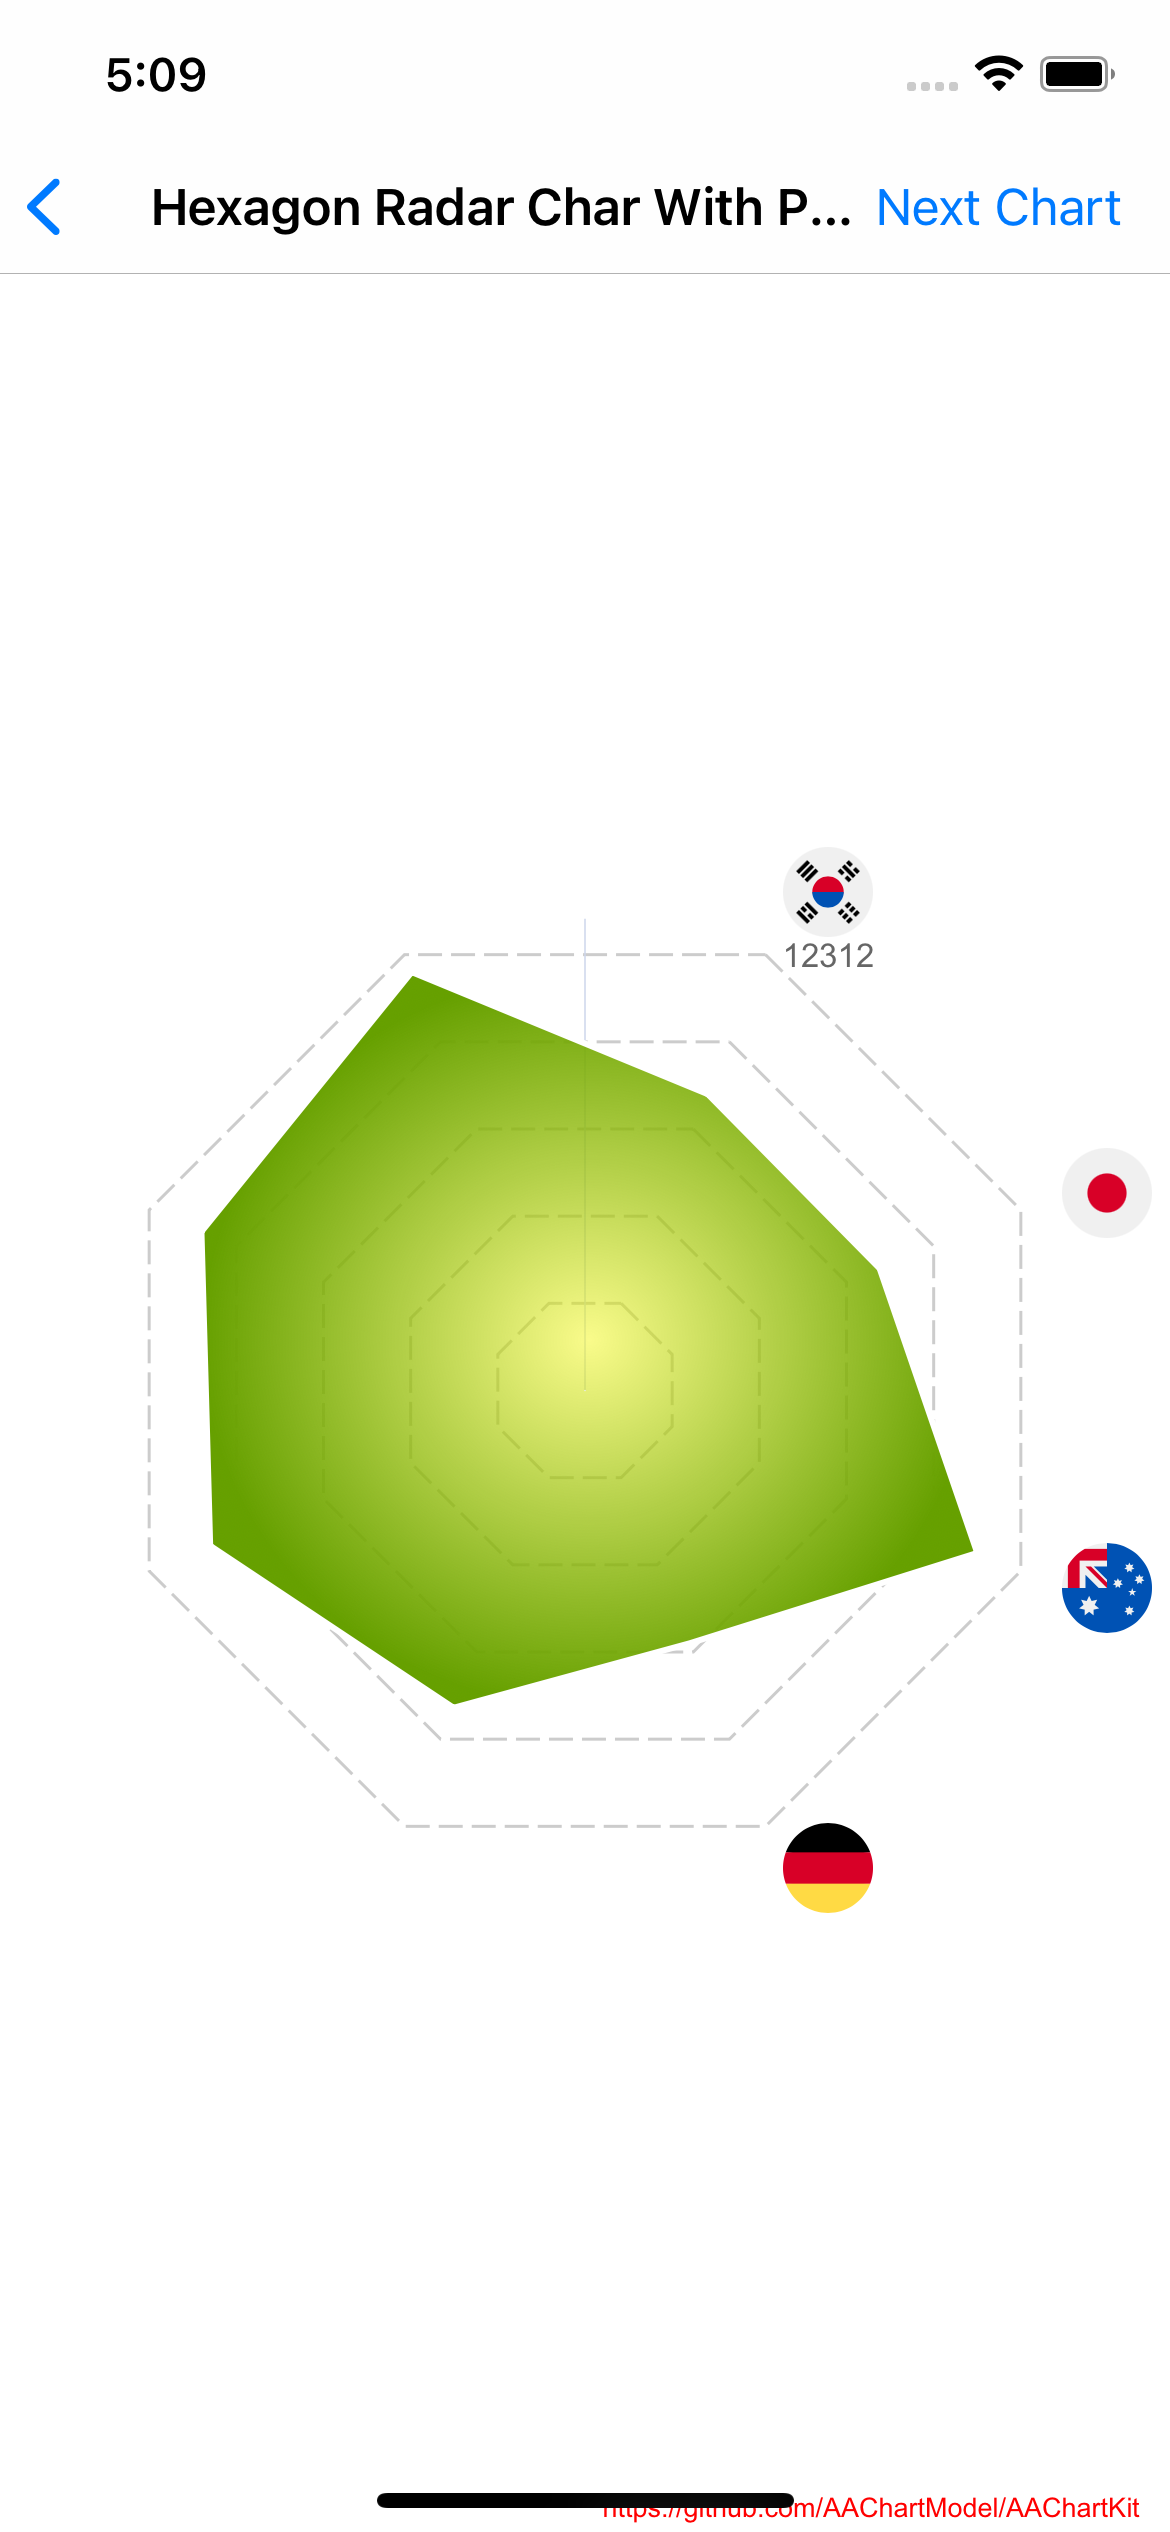 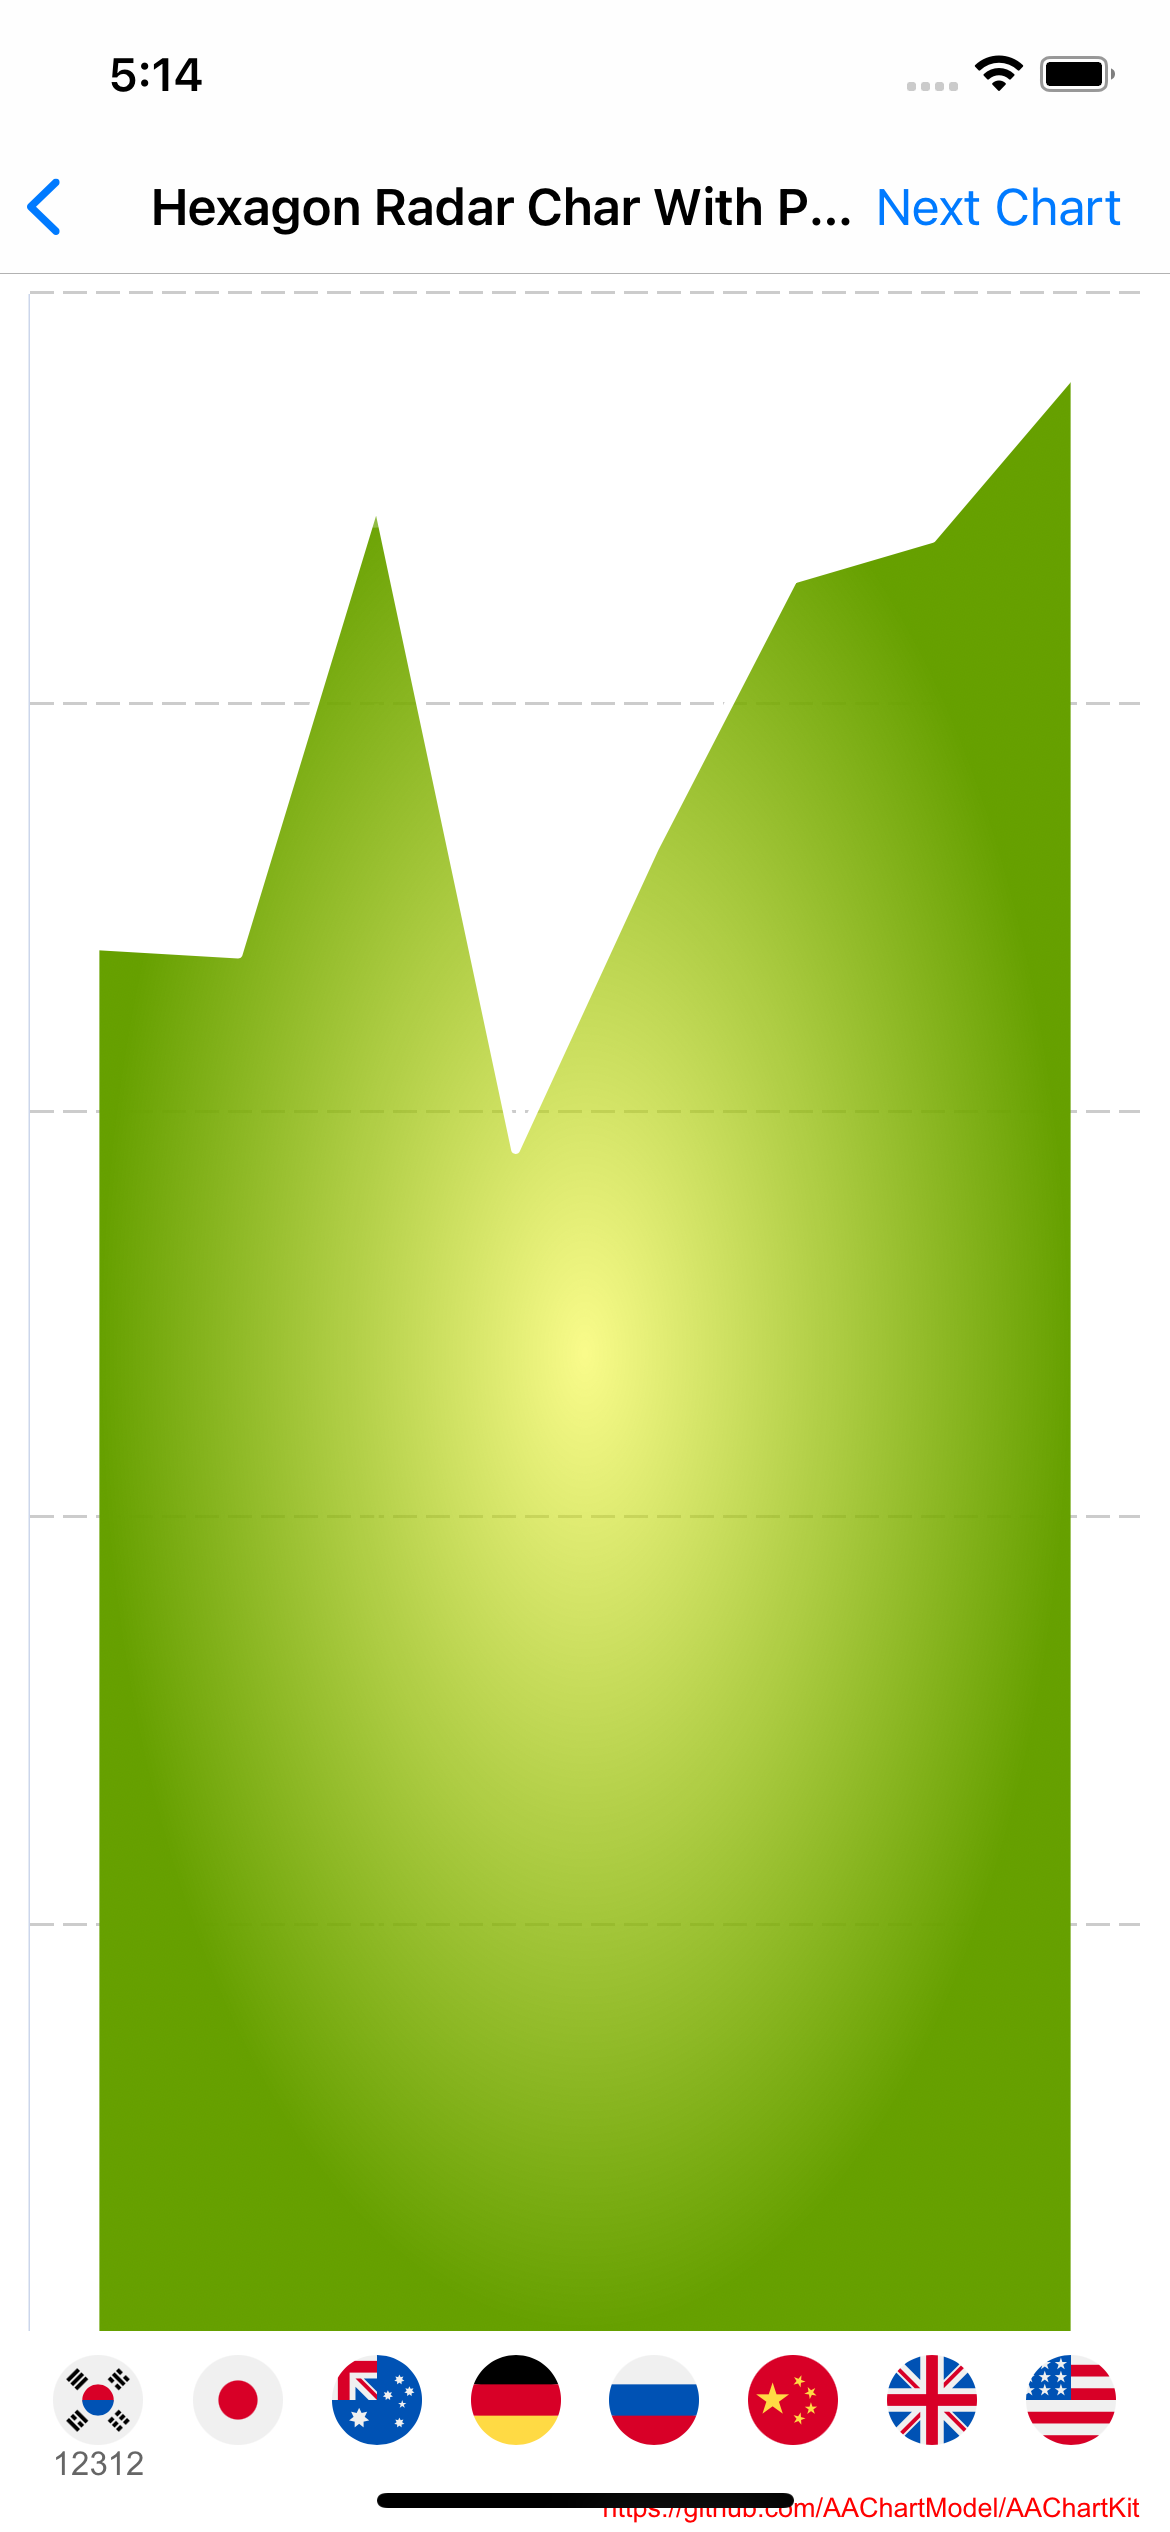
类似于这样 AADataElement 方式替换一点 ,目前不满足我的需求, 我设置的 series 元素是一个数组,接口中的时间戳和值,因为我会绘制多条线 ``` NSMutableArray *data = [NSMutableArray array]; for (PointTimeValueModel *tmModel in pointDataModel.dataList) { if (tmModel.value != nil) { /// 去除服务端为null 的值,, [data addObject: @[@(tmModel.time...

**### 當我在嘗試用infinite while loop 做出實時刷新的圖表時,圖表無法加載,跪求大大們的協助, 以下是我的code:** - (void)viewDidLoad { [super viewDidLoad]; // NSTimeInterval time=[date timeIntervalSince1970];// *1000 是精确到毫秒,不乘就是精确到秒 // NSString *timeString = [NSString stringWithFormat:@"%.0f", time]; [self initDate]; //self.view.frame.size.height - 250; CGFloat...
Metadata
Owner
Metadata
📈📊🚀🚀🚀An elegant modern declarative data visualization chart framework for iOS, iPadOS and macOS. Extremely powerful, supports line, spline, area, areaspline, column, bar, pie, scatter, angular ga...