Ryan Wu
Ryan Wu
In theory, prometheus_tsdb_head_series would go down every two hours by the flag storage.tsdb.min-block-duration set to 2h by default. But in my environment, the value keeps growing and the memory usage...
Hi @bwplotka Thanks for reply. The compaction happened only once when prometheus started. And the metric prometheus_tsdb_compactions_triggered_total's value is 1 all the time just like the picture shows below. 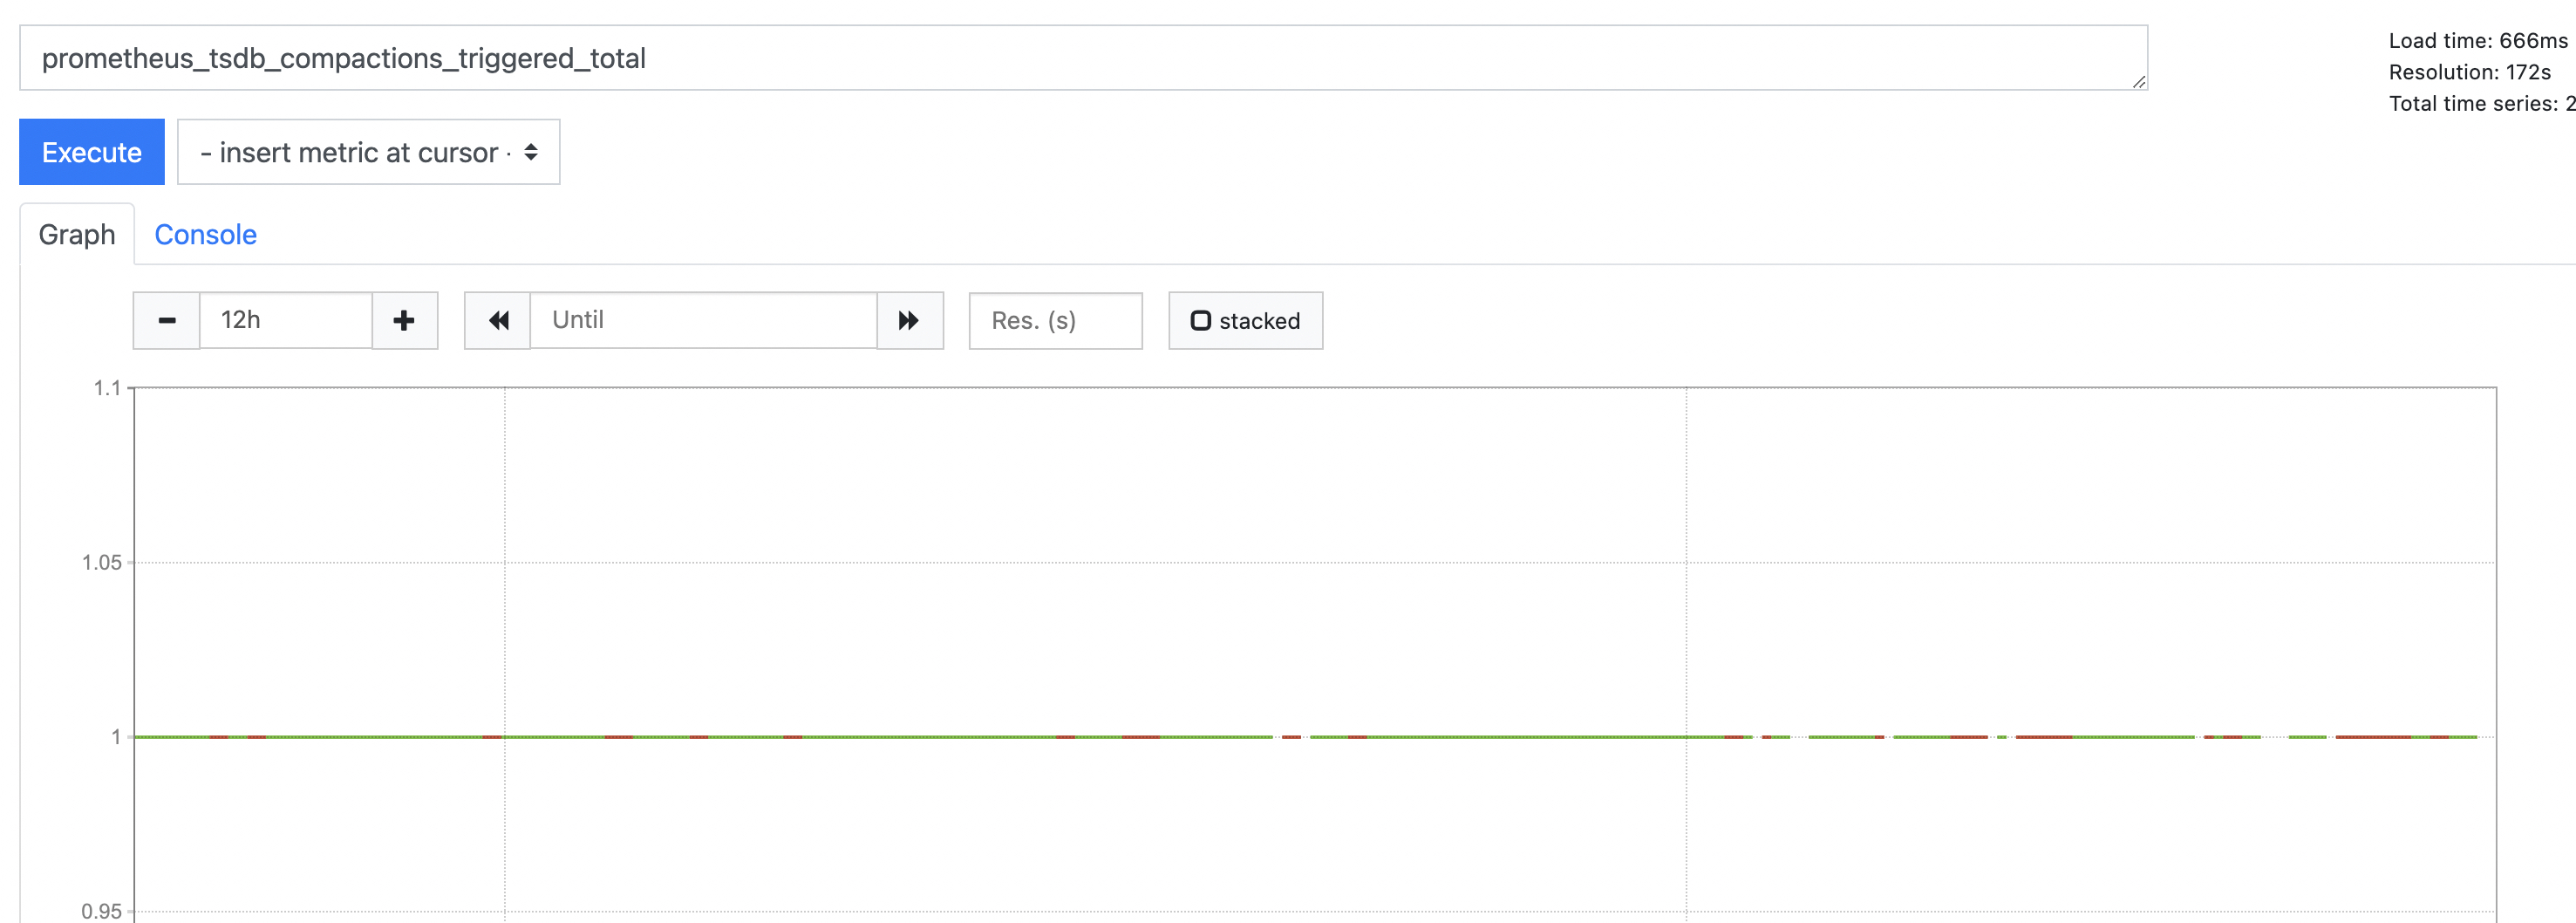...
In theory, prometheus would print a log like below every two hours after writing a new block. ``` level=info ts=2022-06-16T09:01:41.440Z caller=compact.go:495 component=tsdb msg="write block" mint=1655359200000 maxt=1655366400000 ulid=01G5NVV9Q83B5T86AVFVB2GMA1 duration=1m41.336678503s ``` In...
Sloved by #10634
I mean when i simply execute `kubectl-neat` (without -h or --help), there's no output cause the program is waiting for `stdin` which is a little weird if i don't know...
`Export` mode would be a good choice. For me, `kubectl -o wide|custom-columns=...` is useful enough with the **Table format** compared to yaml/json format in daily work. But when it comes...
Same issue
Any updates here?
> We currently use prometheus federation to pull metrics from remote prometheus instances for centralized alerting on some managed environments, however this causes a lot of duplicate metric warnings because...