plotly.R
 plotly.R copied to clipboard
An interactive graphing library for R
This PR proposes a fix to account for the "data_array" property of the "values" attribute of the "dimensions" attribute used in special traces like "parcoords", "parcats" and "splom" traces thereby...

The following generates no plot, no warnings and no errors: ```r # Example from https://plotly.com/r/parallel-coordinates-plot/ library(plotly) df
I have a sunburst plot with four levels. I'm finding that when zoomed out the most, showing all levels, the fourth level of two groups are not displaying until I...
Is there a way to remove the numbers when removing the line graph. It should display the correct data annotation when the particular legend is selected 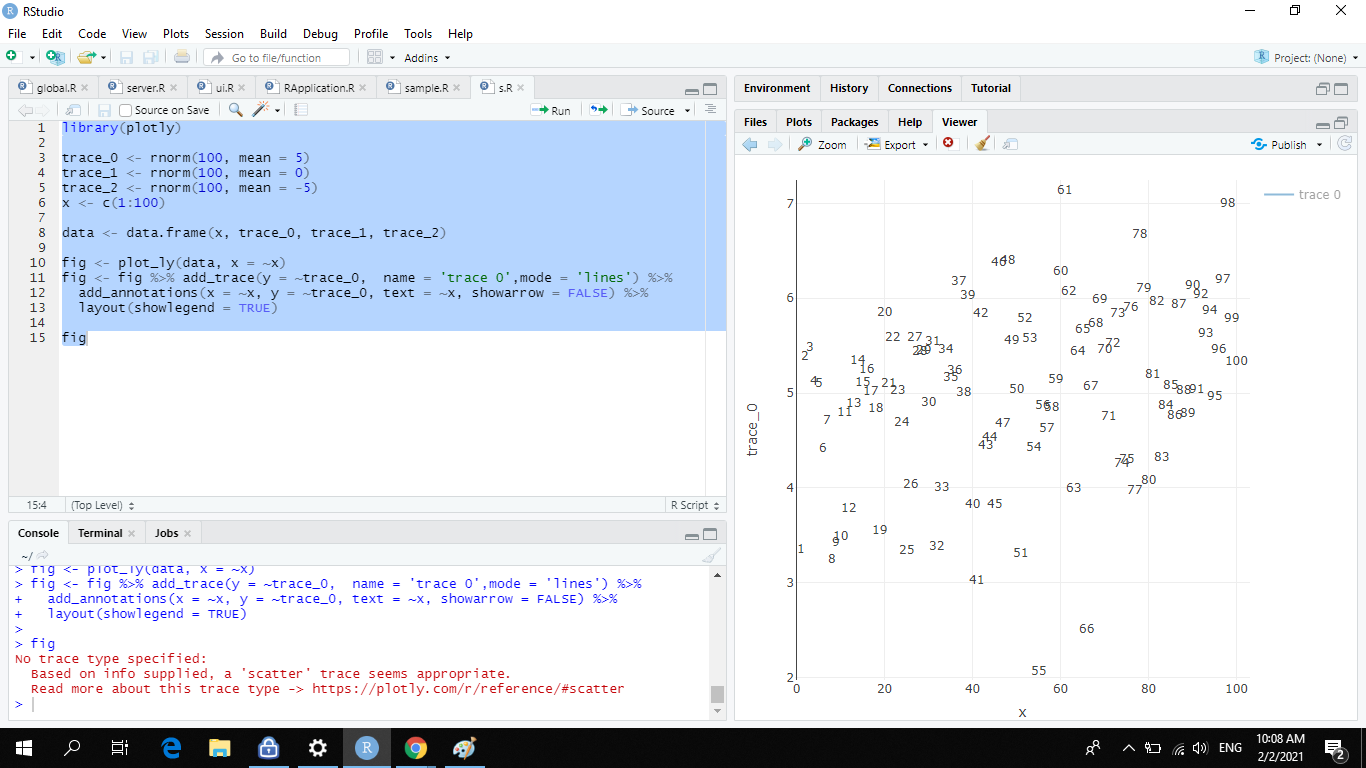 library(plotly) trace_0
Following this message : " geom_NewGeomTile() has yet to be implemented in plotly. If you'd like to see this geom implemented, Please open an issue with your example code at...
I'm trying to make a single chart that has both a bar chart and a relevant pie using subplot(). Subplot is optimal because I'd like the users to be able...
I wish to use ticklabelindex = -1 to make the label correspond to the end of the period. For example, I saw this code: fig.update_layout( xaxis=dict( minor=dict(ticks='outside'), ticks='outside', ticklen=10, ticklabelindex=-1...
When combining Plotly plots using subplots, if ncol is 2 and nrow is greater than 2, the height of the middle row is smaller compared to the top and bottom...