plotly.R

plotly.R copied to clipboard
Plotly in R. How to remove annotation based on the legend. The data points are still there when the legend is hidden.
Is there a way to remove the numbers when removing the line graph. It should display the correct data annotation when the particular legend is selected
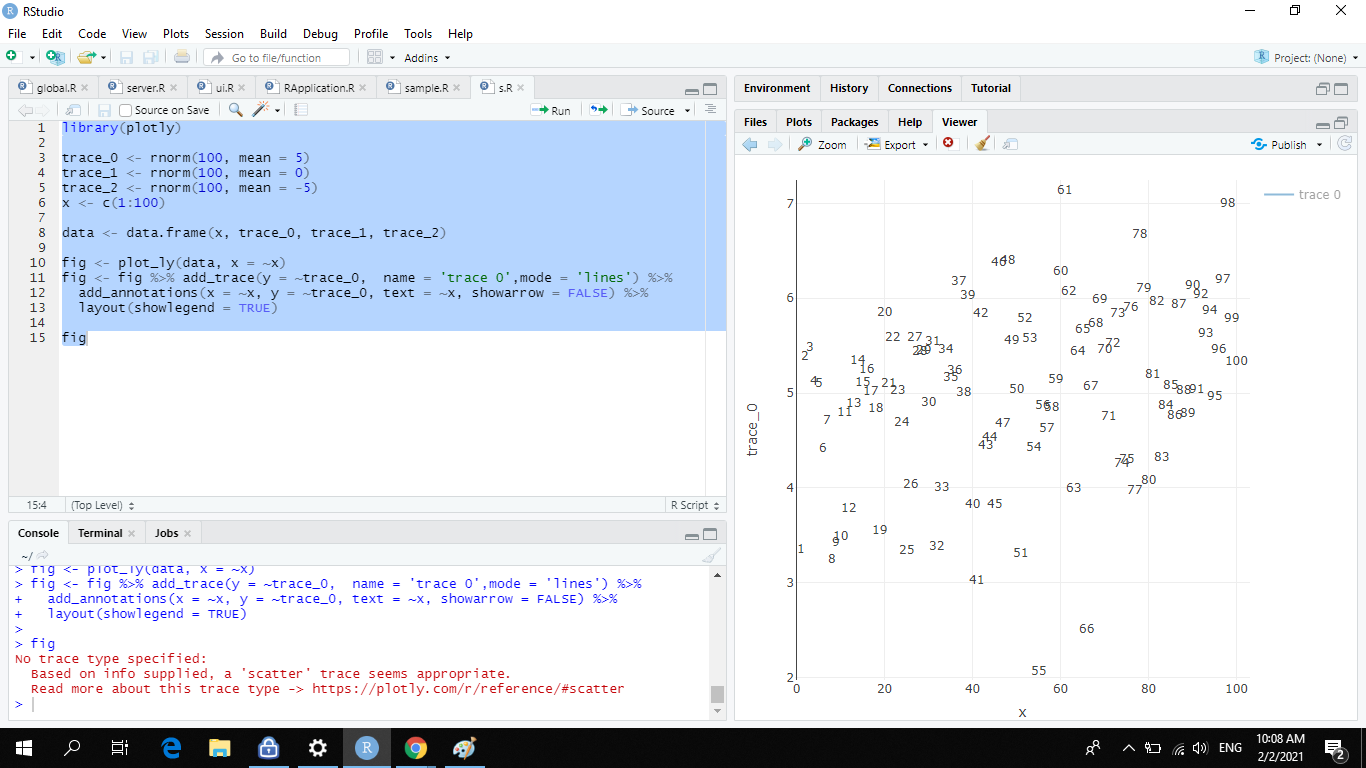
library(plotly)
trace_0 <- rnorm(100, mean = 5) trace_1 <- rnorm(100, mean = 0) trace_2 <- rnorm(100, mean = -5) x <- c(1:100)
data <- data.frame(x, trace_0, trace_1, trace_2)
fig <- plot_ly(data, x = ~x) fig <- fig %>% add_trace(y = ~trace_0, name = 'trace 0',mode = 'lines') %>% add_annotations(x = ~x, y = ~trace_0, text = ~x, showarrow = FALSE) %>% layout(showlegend = TRUE)
fig