Bairui Su
Bairui Su
Add rest node and composition api. Support following nodes: - marks - interval - point - area - line - grid - vector - link - polygon - annotationText -...
- Abstract a _AbstractScale_ function for _ScaleInX_, _ScaleInY_, _ScaleOutX_, _ScaleOutY_. - Use `shape.style.transformOrigin` instead of `shape.setOrigin`.


## 添加 useRelation 工具函数 useRelation 主要用于增加所有比例尺的**条件映射能力**。条件映射能力就是在输入满足指定条件的时候返回期望的值,在不满足条件的情况下走比例尺的默认逻辑。比如在下面的热力图的例子中,需要当值为 NaN 的时候为灰色,在值为 0 的时候为白色,其他的时候就走比例尺的默认映射逻辑。也可以看这个 https://github.com/antvis/G2Plot/issues/3329 里面提到的问题。 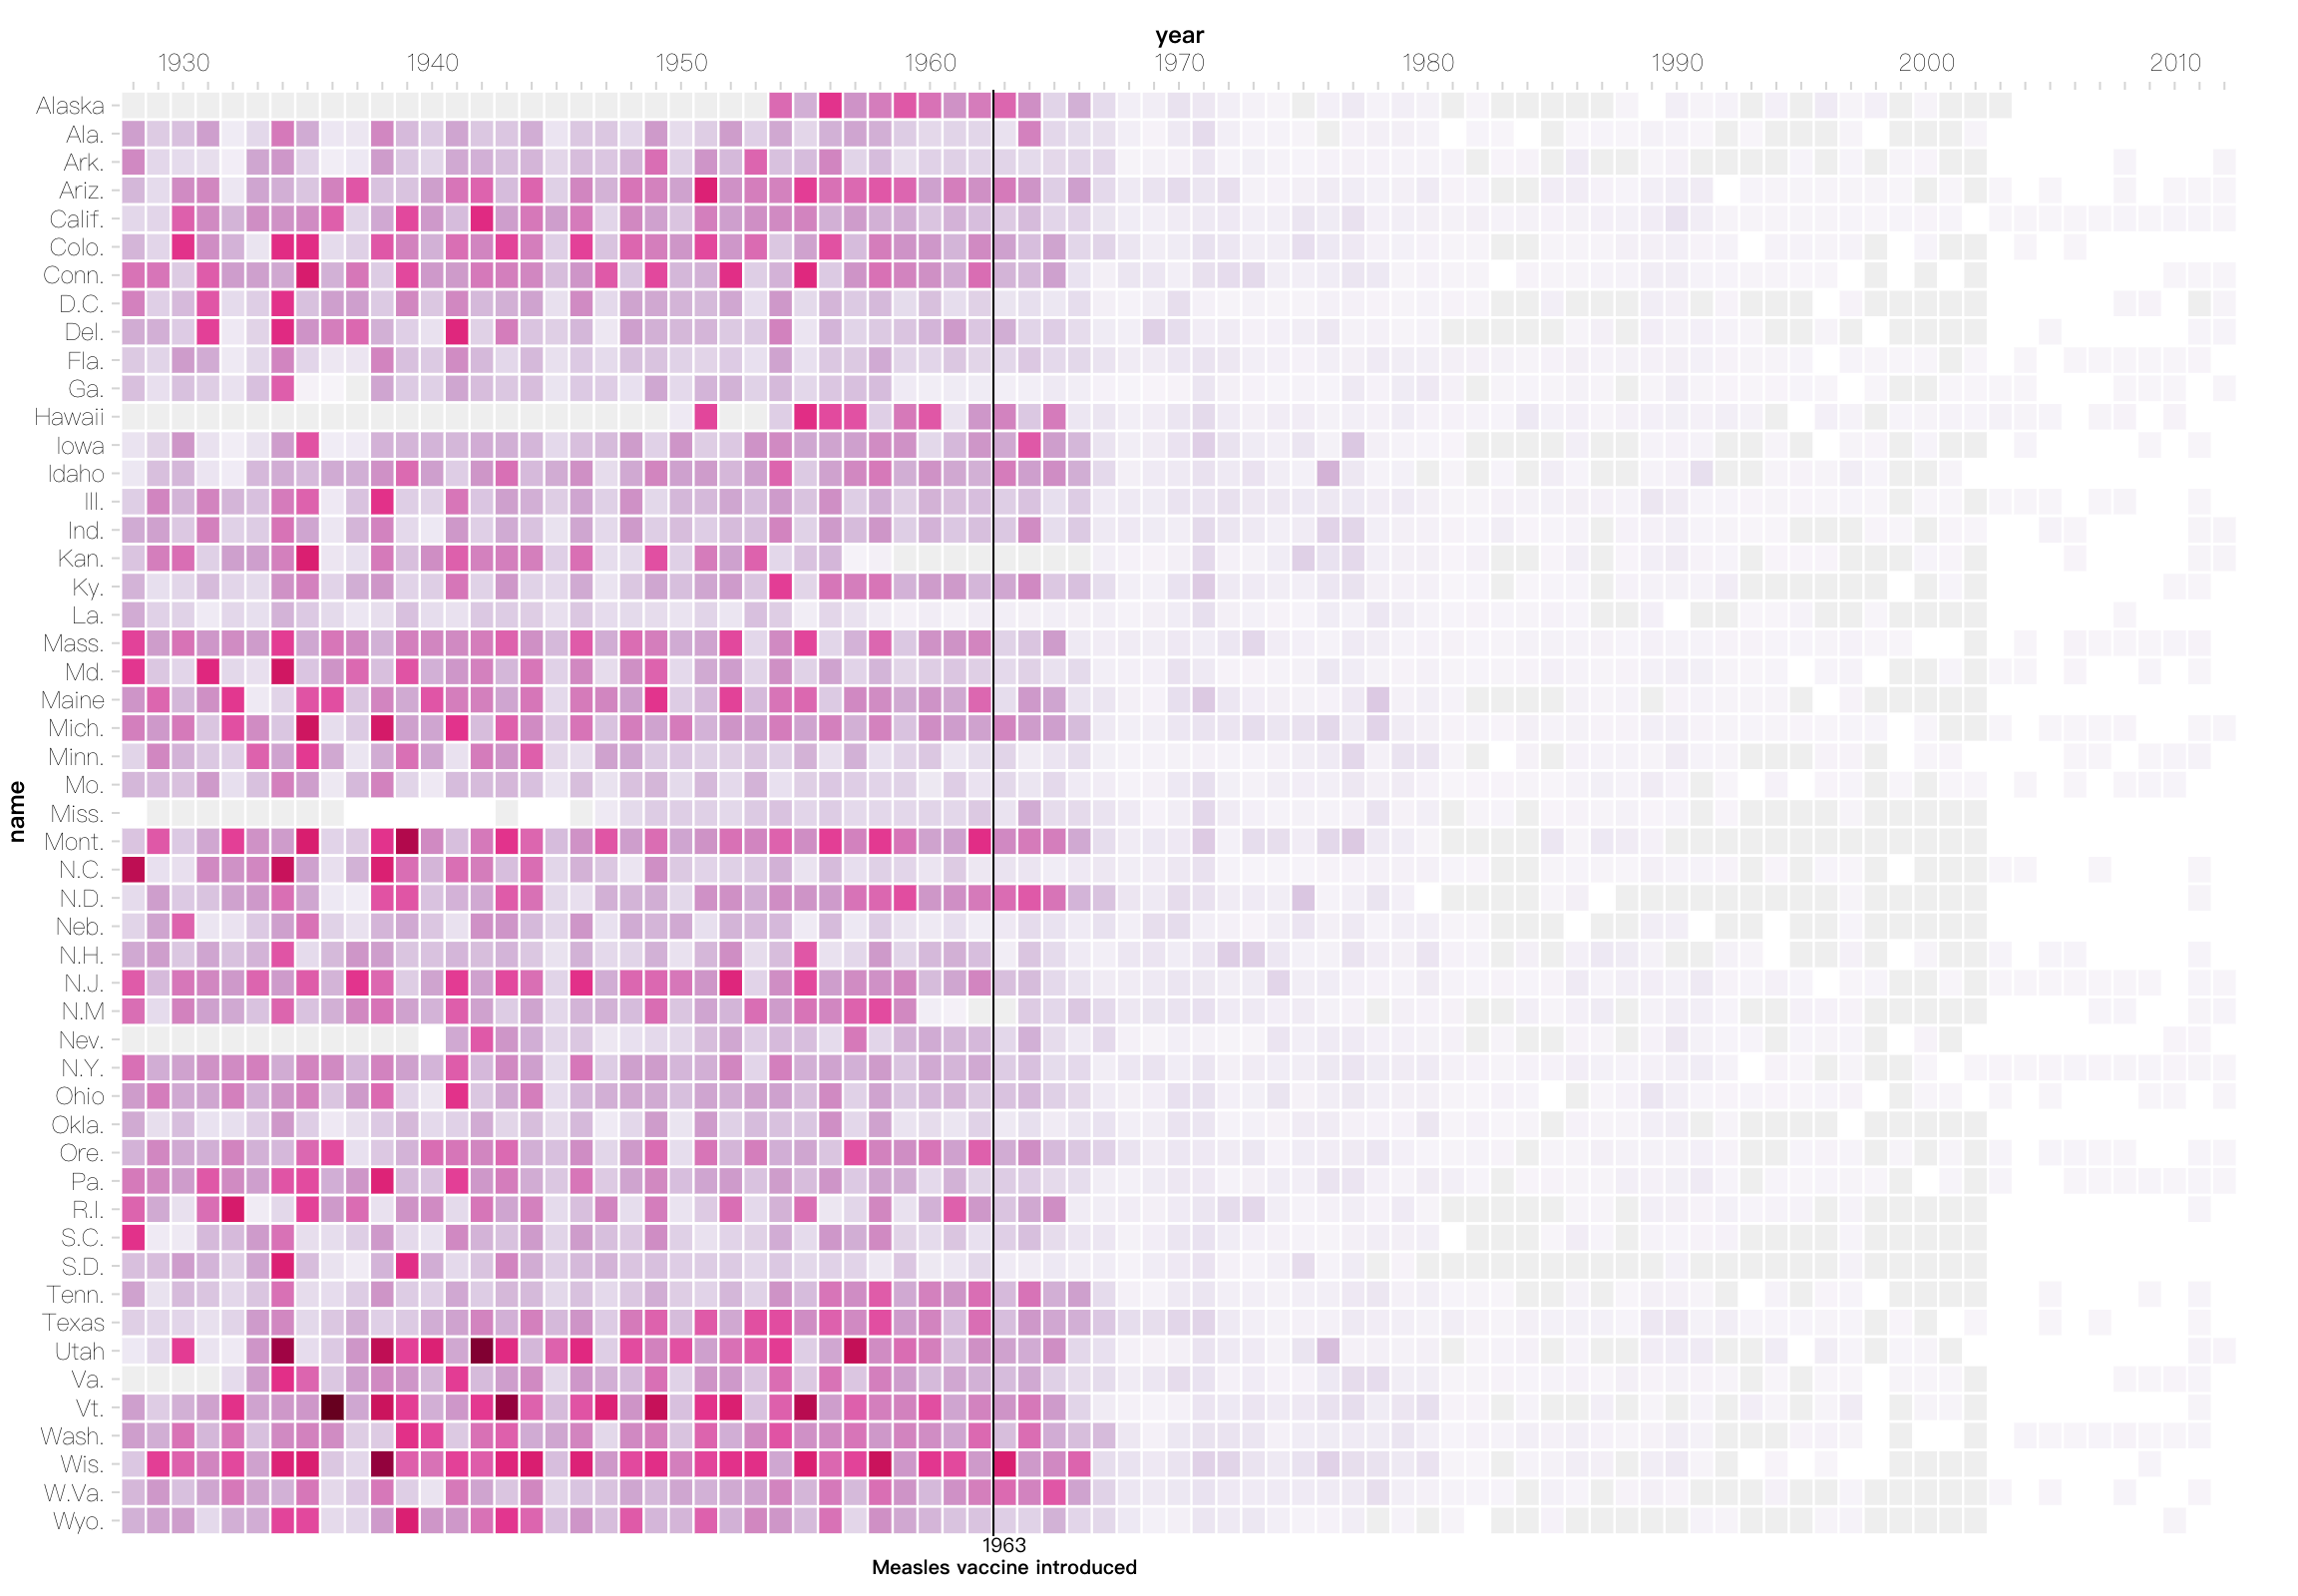 ## 使用方式 - 在 scale 中的使用方式 ```js import { Sequential, useRelation } from '@antv/scale'; const scale =...
- Split `computeBandState` into `computeBandState` and `computeFlexBandState` for performance. - Use [d3.internMap](https://github.com/d3/d3-array#InternMap) instead of Map to compute flex band state to handle temporal domain.
# Interval - 支持 size 通道和圆角。 - 在非极坐标系下,使用 `G.Rect` 去渲染 Interval(为了支持圆角),之前是用 `G.Path`。  ```js G2.render({ type: 'interval', data: commit, encode: { x: 'name', y: 'value', color: 'name', size: 80, },...
```js import {register} from '@antv/g2'; register('interaction.custom', /** .. **/); ```
```js const chart = new G2.Chart(); chart.changeSize({ width: 500, height: 500, paddingLeft: 10}) ```
```js const chart = G2.Chart(); const context = chart.context(); context.views[0]; // {scales, coordinate} ```