Kaifat
Kaifat
How can I set time format of xAxis? For example I whant to show %d.%m if not scaled and %H%M if scaled https://jsfiddle.net/anf5nk30/3/
Hi, u made very cool program. Is there any easy way to visualise wind data with d3 on leaflet tile maps like openstreetmaps?
IceCore

It will complitely perfect if you visualize ICEC data from NOAA on your map. There are many people need this information.
Picker instead of TextInput has no prop messageColor, so seems, it's don't to be posible to change.
OS: Windows 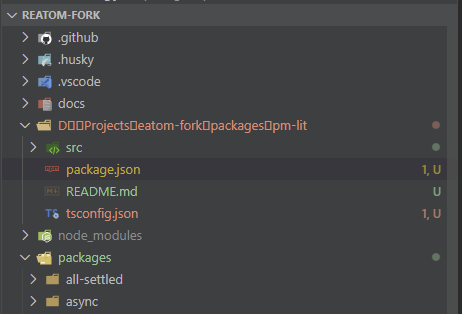 ```JSON { "name": "@reatom/", "version": "3.1.0", "private": false, "sideEffects": false, "description": "Reatom for ", "source": "src/index.ts", "exports": { "require": "./build/index.js", "default": "./build/index.module.js" }, "main": "build/index.js", "module": "build/index.module.js",...
**Checklist** - [+] Did you run the analyzer with the `--dev` flag to get more information? - [-] Did you create a **minimal** reproduction in the [playground](https://custom-elements-manifest.netlify.app/)? CEM can't resolve...
Now there is error inside worker: ```javascript import {analyzeText, transformAnalyzerResult} from 'web-component-analyzer' const generate = async (path: string) => { const response = await fetch(path) const result = await response.text()...
Now json is not compatable with api-viewer becouse of schema