Peter
![]()
![]()
Peter
Ad 1) Here the screen shot: 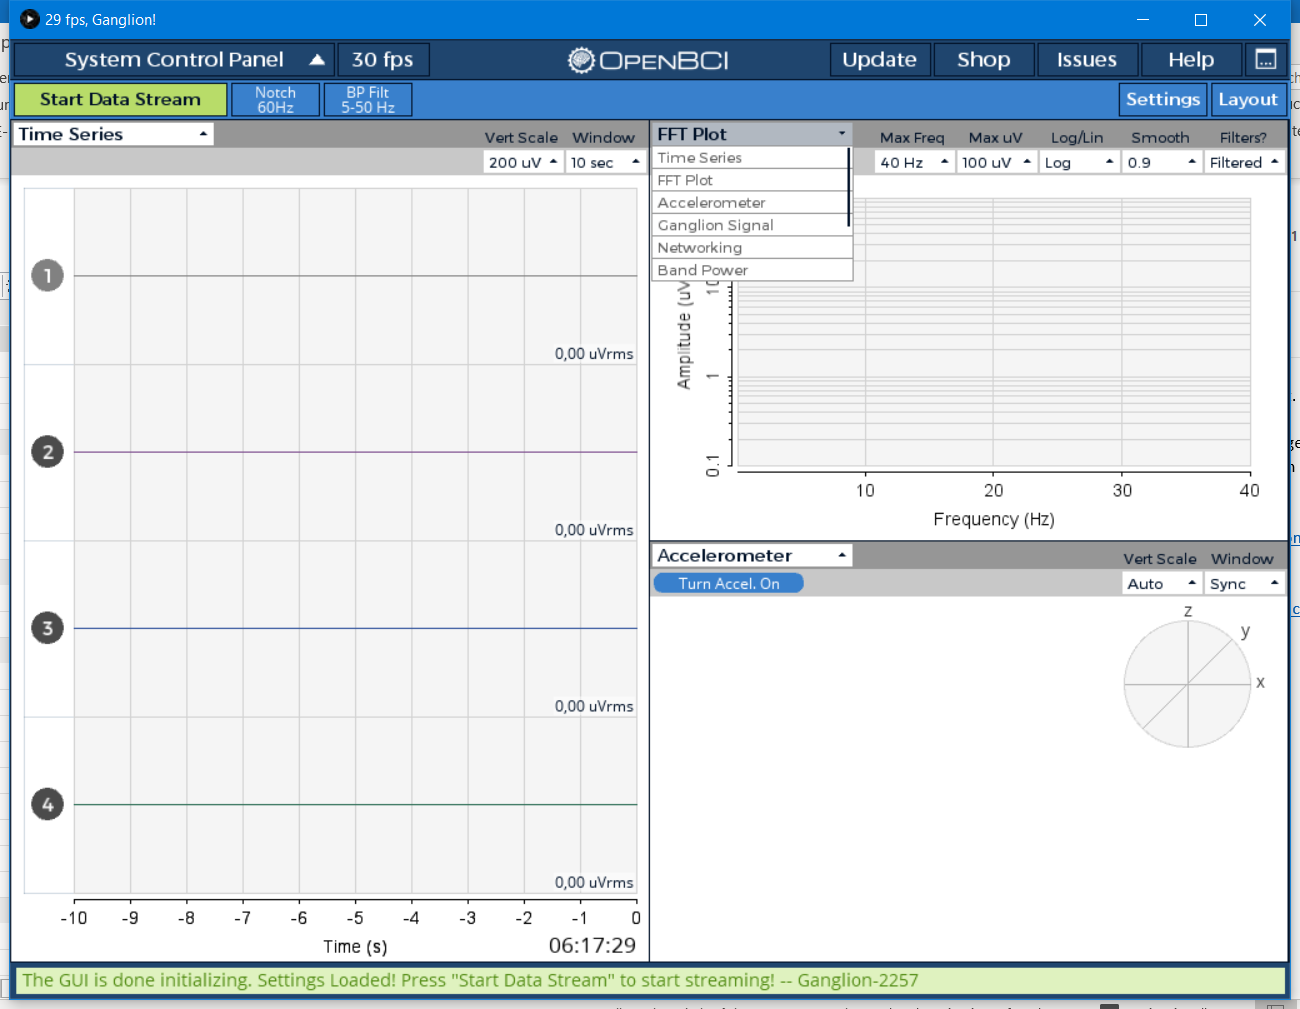 To reproduce this you need to close GUI WITHOUT having spectrogram selected. Then if you change layout you get this 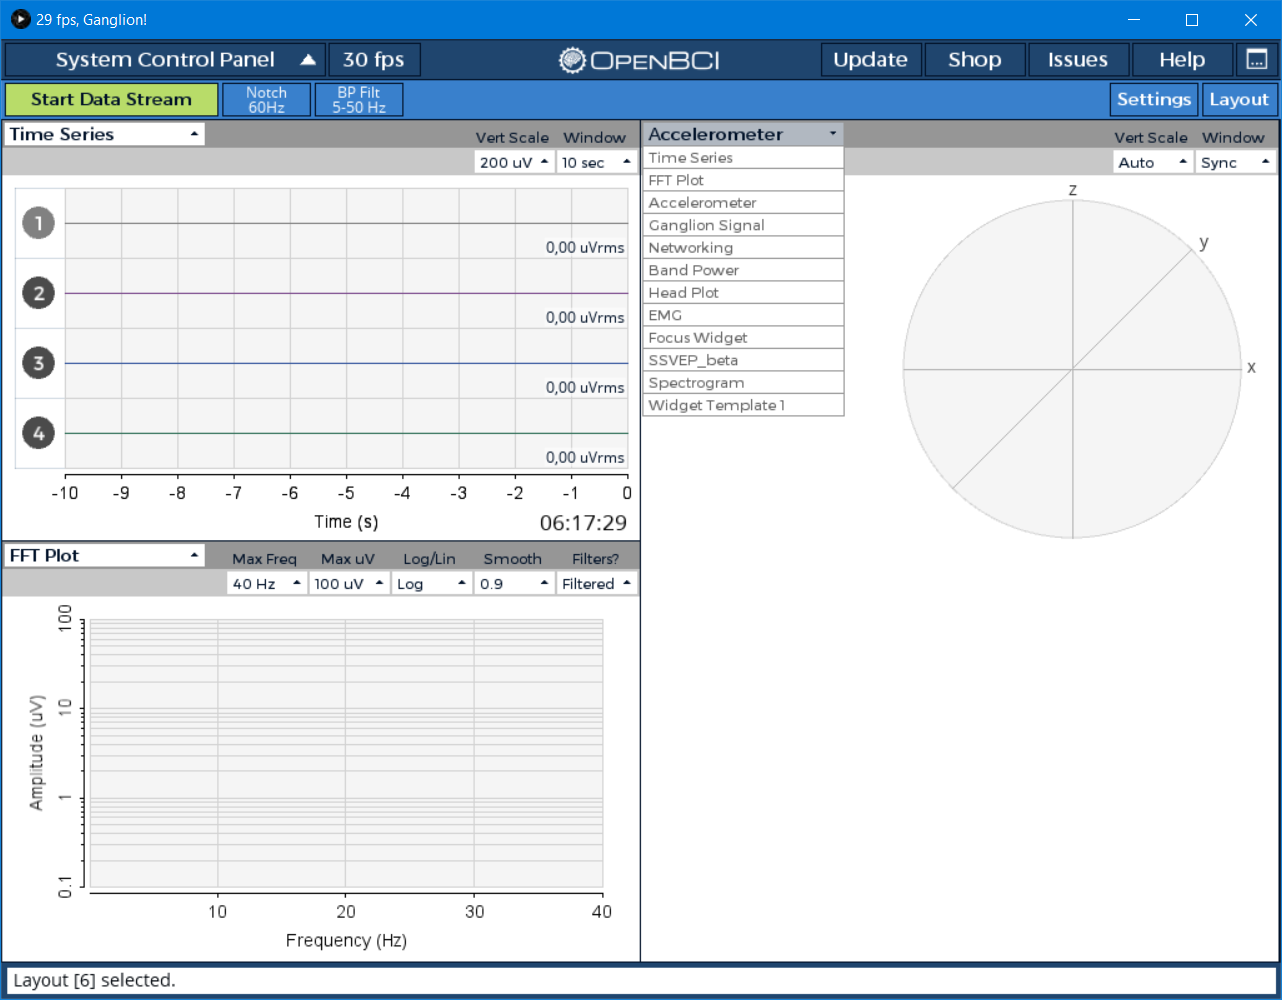 Then everything...
Ad2: You can see the FFT displays correctly the 50Hz while the spectrogram does not 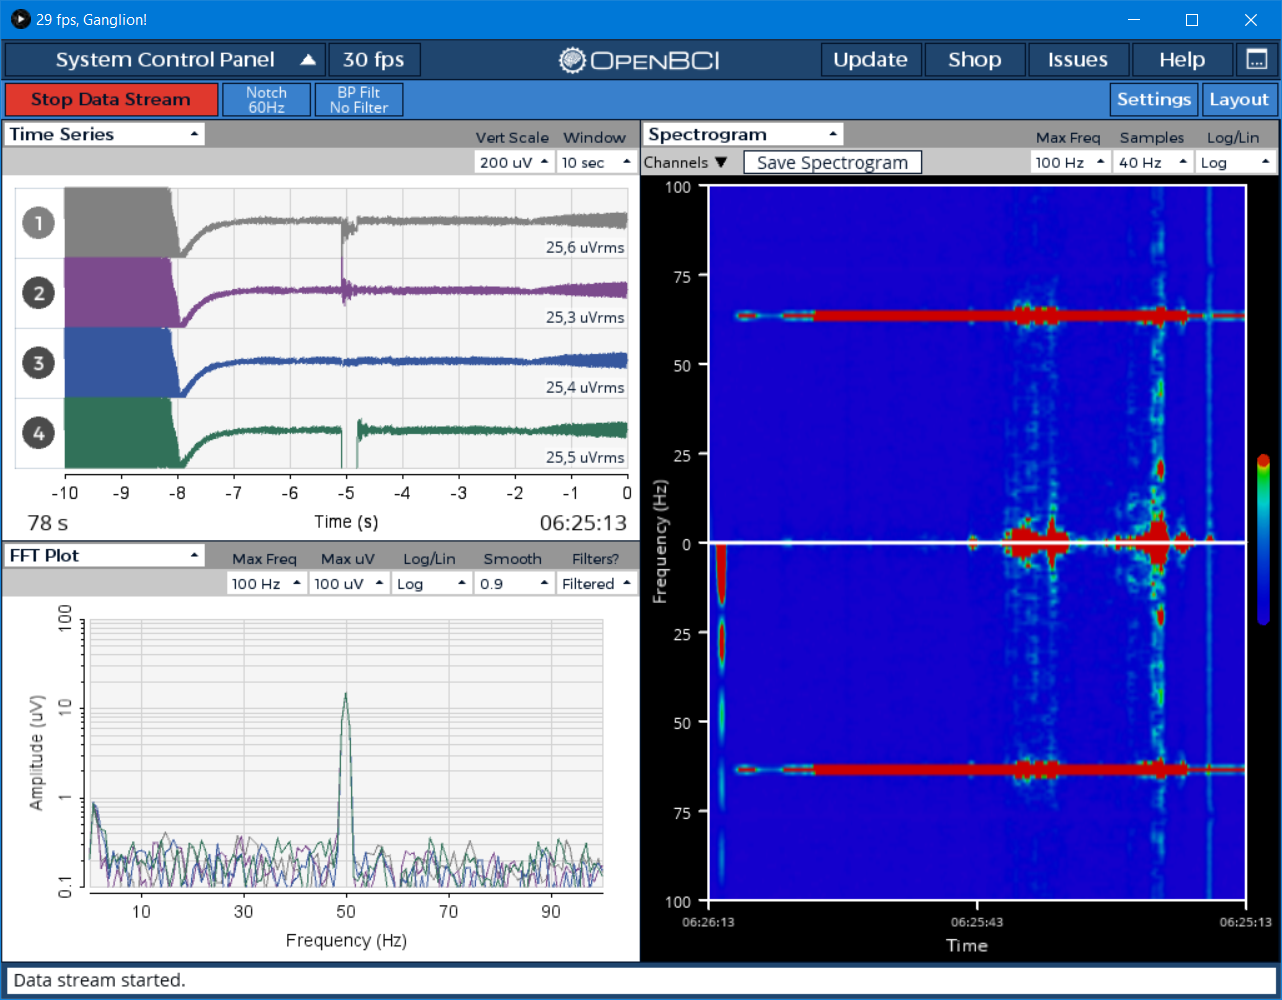
Ad 4) I do not understand There should be a dropdown like the window in the time series selecting the span of the x axis. ( 1,2,5,10,20,50 min . However...
Ad 3) you may add a kind of a gain dropdown menu setting doing blue = 0,1uV, 1uV, 10 uV . the span should always be 3 decades. I do...
Ad 1: This point can be closed. I simply did not notice the selector bar.
Looks good, Not sure what you want to say. Have you changed something that it is ok now? Frequency reading should be consistent with FFT plot. Remark: To display 50Hz...
so it is ok now
thank you
>>I have same issue with wifi shield but not with USB dongle.>> So it is likely that you have electrical/ magnetical interference from the shield. You see also in your...
thank you