Jochen Platzgummer
Jochen Platzgummer
We are using oxidized through a ssh proxy (different jumphosts) to access switches on different sites. This is working very well as we are connecting to switches using SSH, but...
OS: CentOS 7.x (latest) After upgrading logstash from version 7.16.3 to latest version 7.17.5 logstash is not producing logs under `/var/log/logstash/` but logstash is working fine and is processing logfiles....
``` centreon_plugins.pl --connector-hostname=127.0.0.1 --connector-port=5700 --container=XXX --plugin=apps::vmware::connector::plugin --custommode=connector --mode=cpu-cluster --debug UNKNOWN: Cannot get value for counters (Maybe, object(s) cannot be reached: disconnected, not running, time not synced (see time-host mode),...) {"identity":"client-81555e8caba4438a8e94e72a42d7efa1","data":{},"short_message":"Cannot...
It should be nice to add the possibility to monitor the meeting quality for Google Meet. Google Meet API: https://developers.google.com/admin-sdk/reports/v1/appendix/activity/meet Here some screenshot from the Google Meet Quality Tool: Overview...
apps::vmware::connector::plugin --mode=datastore-snapshot - timeout when checking NAS NFS datastore

latest plugins & vmware connector ``` centreon_plugins.pl --connector-hostname=127.0.0.1 --connector-port=5700 --container=xxx --plugin=apps::vmware::connector::plugin --custommode=connector --mode=datastore-snapshot --datastore-name='NAS-CA' UNKNOWN: Cannot get response (timeout received) ```  All other datastores are working
It should be nice to have a direct Weblogic monitoring (without Jolokia). To monitor Weblogic servers status you can use this URL: /management/wls/latest/servers https://docs.oracle.com/middleware/1213/wls/WLRMR/management_wls_version_servers.htm#WLRMR234 You can find a curl output...
If you have a Cisco stack monitoring the uptime using snmp show's only the uptime for the complete stack. Monitoring the uptime from any single stack member could allow to...
if you have a PA with physical disks it should be nice to have a mode to monitor the raid/disk status using SSH example with configured raid and failed disk...
It should be nice to have dedicated modes to monitor Meraki AP for: - Channel utilization (2,4 & 5 GHz) 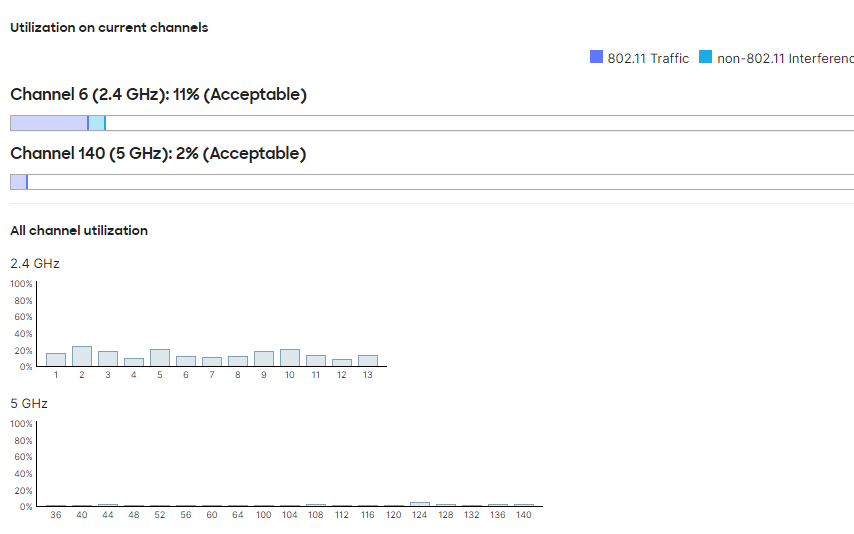 - Uplink traffic 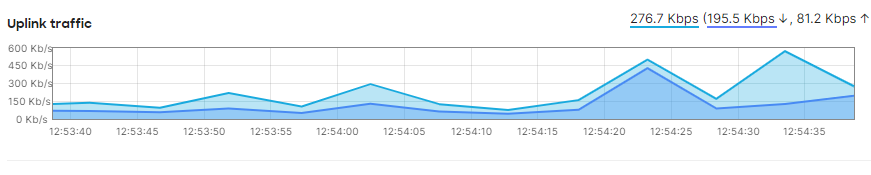 - current clients (VLAN ID,...
It should be great to have support for Veeam365. Could be monitored through PS. Here is the official documentation: https://helpcenter.veeam.com/docs/vbo365/powershell/veeam_psreference.html?ver=50 - Backup status and list-backup: Get-VBOJob - Backup repository: Get-VBORepository...