Håkon Høgstøl
Håkon Høgstøl

Use same track header size for all tracks to align all data plot with respect to the depth axis (ref. StimPlan model plots)
Since a well log plot can include a number of curves on a number of tracks, set up with specific line, fill or symbol appearances, this is beneficial to store...
When DATA-file is available, parse Schedule section recursively to identify all WSEGLINK keywords with data. New links are listed by well and segment-to-segment. WSEGLINK well-name segment-no-1 segment-no-2 / . ....
/home/jenkinstr/workspace/resinsight-dev-rhel7/Fwk/AppFwk/cafProjectDataModel/cafPdmUiCore/cafInternalPdmUiFieldCapability.inl:30: CAF_ASSERT(optionIndex < static_cast( m_optionEntryCache.size() )) failed
For drop down list, only 1 and "All" is available at first, then -1 is shown.
Display actual Fm. names (horizontally) when Curve Data type "Formation Names" is selected, separated with horizontal lines representing cell layers between Formations. If possible, color by Formations and dashed lines...
Imported observed summary data can not be plotted in 2022.06.0. Time column selection is changed compared to previous version, with "Dates"-field for first column being duplicated. 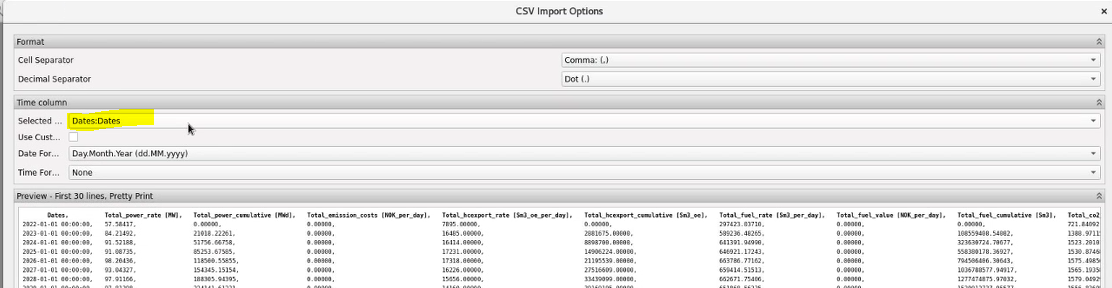
Allow user to investigate VFP curves at simulated well or group conditions to identify challenge with lift performance. Plot WBHP vs well rate (liquid, oil, water, gas) at given time...
Allow user to define min and max for x- and y-axis in VFP plot.