grdnryn
grdnryn
Hi Daniel, In the above reply: https://github.com/matplotlib/mplfinance/issues/364#issuecomment-803557249 You state: The reason you are seeing the apparent x-axis mismatch is because you are allowing show_nontrading to default to False. When this...
Thanks Daniel, Since output speed is not a determining factor here, I was able to do a combination of both (make_addplot and external axes). I created a sort of a...
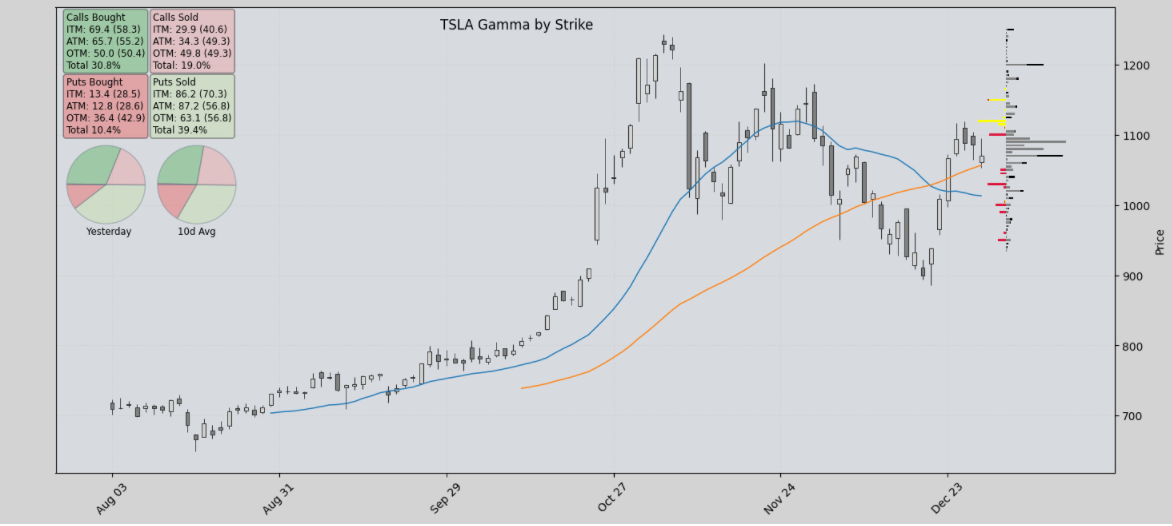
@AGG2017 I have used you little snippet from here (https://github.com/matplotlib/mplfinance/issues/162#issuecomment-950386424) to use this volume profile method to plot option strike data on the chart. Thanks! My question is: Is it...
Thank you Daniel. The kwarg `left=` did the trick. Thought I had tried that, but I was probably doing something else wrong at that point in time!
Yes, I apologise for not doing that. When trying to reproduce a code snippet the pie chart would in fact appear (and hence not produce ValueError), but the pie chart...
Thank you very much Daniel. This will be sufficient to accomplish what I was trying to achieve.
Still a work in progress, but starting to visulise things they way I would like. Thanks again.