plot
 plot copied to clipboard
A repository for plotting and visualizing data

I'm trying to use gonum plot with gio. I copied the example at https://github.com/gonum/plot/blob/master/vg/vggio/vggio_example_test.go and tried to run it somehow. The result when building is: ``` Build Error: go build...
### What are you trying to do? Plot data with labels on a log-log plot. Sometimes, no tick numbers are being displayed (depending on the data). ### What did you...
I've added custom labels to my X axis but the text is getting cut off (the bottom half of the "y" in "May" isn't visible). Is there a way to...
Useful for plots that include chemical names, variables, etc. (example: R2). A possible way to implement this would be to support a subset of Markdown or HTML syntax (for subscript...
### What are you trying to do? Render a plot to SVG with a certain font as a default for title and axis ### What did you do? ```golang plot.DefaultFont...
as can be noticed from the produced plot in #732, (even with the 1:1 ratio), axes are not exactly aligned between plots (Y-axis for top-left/bottom-left, X-axis for bottom-left/bottom-right):  I've...
this has come up on slack. it would be great to be able to implement this kind of plot: - https://matplotlib.org/stable/gallery/axes_grid1/scatter_hist_locatable_axes.html#sphx-glr-gallery-axes-grid1-scatter-hist-locatable-axes-py 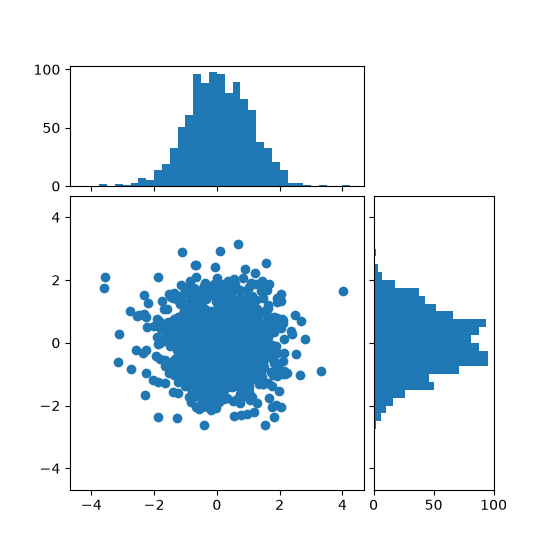 to achieve this sort of thing, we need...
The glyphbox for axes labels that aren't centered (the default position), isn't correctly computed: 
working on https://github.com/gonum/plot/pull/708 uncovered a slew of bugs related to `plot.GlyphBox{,er}`. we should probably test more thoroughly the various modes in which `plot.GlyphBox`es are involved: - [ ] with a...