plot

plot copied to clipboard
plot: consider implementing a rotated/transformed canvas
this has come up on slack. it would be great to be able to implement this kind of plot:
- https://matplotlib.org/stable/gallery/axes_grid1/scatter_hist_locatable_axes.html#sphx-glr-gallery-axes-grid1-scatter-hist-locatable-axes-py
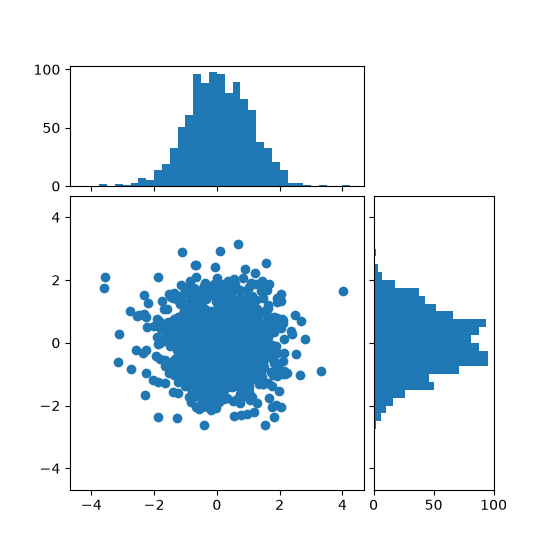
to achieve this sort of thing, we need to be able to rotate a plot to tack it on the right hand side of the bottom left plot.
the following program is an attempt at reproducing the same plot (sans the rotated canvas).
package main

import (
	"flag"
	"image/color"
	"log"
	"math/rand"
	"os"

	"gonum.org/v1/plot"
	"gonum.org/v1/plot/plotter"
	"gonum.org/v1/plot/vg"
	"gonum.org/v1/plot/vg/draw"
	"gonum.org/v1/plot/vg/vgimg"
)

func main() {
	var ratio = flag.Bool("ratio", false, "apply a 1/3 ratio")
	flag.Parse()

	const (
		rows = 2
		cols = 2
	)

	var blue = color.RGBA{R: 24, G: 90, B: 169, A: 255}

	ps := make([][]*plot.Plot, rows)
	for i := range ps {
		ps[i] = make([]*plot.Plot, cols)
		for j := range ps[i] {
			if i == 0 && j == 1 {
				continue
			}
			ps[i][j] = plot.New()
		}
	}

	const N = 1000
	rnd := rand.New(rand.NewSource(1))
	data := make(plotter.XYs, N)
	xs := make(plotter.Values, N)
	ys := make(plotter.Values, N)
	for i := range data {
		xs[i] = rnd.NormFloat64() * 2
		ys[i] = rnd.NormFloat64()
		data[i].X = xs[i]
		data[i].Y = ys[i]
	}

	s, err := plotter.NewScatter(data)
	if err != nil {
		log.Panic(err)
	}
	s.GlyphStyle.Color = blue
	s.GlyphStyle.Radius = vg.Points(3)

	ps[1][0].Add(s)

	// histo-x
	hx, err := plotter.NewHist(xs, 20)
	if err != nil {
		log.Panic(err)
	}
	hx.FillColor = blue
	hx.LineStyle.Color = blue

	ps[0][0].Add(hx)

	// histo-y
	hy, err := plotter.NewHist(ys, 20)
	if err != nil {
		log.Panic(err)
	}
	hy.FillColor = blue
	hy.LineStyle.Color = blue

	ps[1][1].Add(hy)

	const (
		xsize = 30 * vg.Centimeter
		ysize = 30 * vg.Centimeter
	)
	img := vgimg.New(xsize, ysize)
	dc := draw.New(img)

	const padding = 0.2 * vg.Centimeter
	t := draw.Tiles{
		Rows:      rows,
		Cols:      cols,
		PadTop:    padding,
		PadBottom: padding,
		PadRight:  padding,
		PadLeft:   padding,
		PadX:      padding,
		PadY:      padding,
	}

	cs := plot.Align(ps, t, dc)

	// aspect ratio.
	if *ratio {
		var (
			top = &cs[0][0]
			mid = &cs[1][0]
			rhs = &cs[1][1]
		)
		top.Rectangle.Min.Y += 0.6 * top.Rectangle.Size().Y
		top.Rectangle.Max.X += 0.6 * top.Rectangle.Size().X

		mid.Rectangle.Max.Y += 0.6 * mid.Rectangle.Size().Y
		mid.Rectangle.Max.X += 0.6 * mid.Rectangle.Size().X

		rhs.Rectangle.Max.Y += 0.6 * rhs.Rectangle.Size().Y
		rhs.Rectangle.Min.X += 0.6 * rhs.Rectangle.Size().X
	}

	ps[0][0].X.Tick.Marker = NoTicks{}
	ps[1][1].Y.Tick.Marker = NoTicks{}

	for j := 0; j < rows; j++ {
		for i := 0; i < cols; i++ {
			if ps[j][i] == nil {
				continue
			}
			ps[j][i].Draw(cs[j][i])
		}
	}

	w, err := os.Create("rotated-canvas.png")
	if err != nil {
		panic(err)
	}
	defer w.Close()

	png := vgimg.PngCanvas{Canvas: img}
	if _, err := png.WriteTo(w); err != nil {
		panic(err)
	}
}

// NoTicks implements plot.Ticker but does not display any tick.
type NoTicks struct{}

// Ticks returns Ticks in a specified range
func (NoTicks) Ticks(min, max float64) []plot.Tick {
	return nil
}
