A Gautham
Results
1
issues of
A Gautham

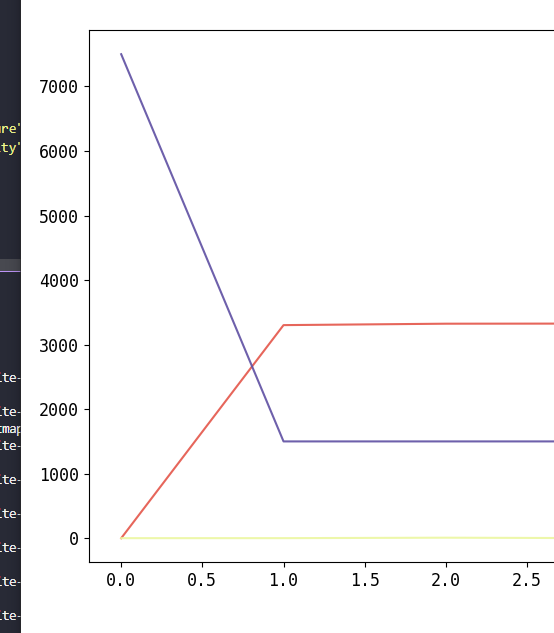
So I am trying plot three different of data on same graph, the difference between the ranges are big that one plot appears as a line.