MPAndroidChart
 MPAndroidChart copied to clipboard
A powerful 🚀 Android chart view / graph view library, supporting line- bar- pie- radar- bubble- and candlestick charts as well as scaling, panning and animations.

V3.1.0 BarDataSet do not have setFills method i want to use gradientFills
**Summary** App crash while dragging/ zooming a live data line chart. java.lang.IndexOutOfBoundsException: Index: 59, Size: 59 at java.util.ArrayList.get(ArrayList.java:437) at com.github.mikephil.charting.data.DataSet.getEntryForIndex(DataSet.java:294) at com.github.mikephil.charting.renderer.LineChartRenderer.drawCircles(LineChartRenderer.java:660) at com.github.mikephil.charting.renderer.LineChartRenderer.drawExtras(LineChartRenderer.java:594) at com.github.mikephil.charting.charts.BarLineChartBase.onDraw(BarLineChartBase.java:255) at android.view.View.draw(View.java:20250) at android.view.View.updateDisplayListIfDirty(View.java:19125)...
**Summary** **Expected Behavior** **Possible Solution** **Device (please complete the following information):** - Device: [e.g. Google Pixel] - Android Version [e.g. 7.0] - Library Version (e.g. 3.1.0-alpha) **Additional Context** My requirement...
setting xAxis label count with data set changes results in old dataset values passed to formatter ## PR Checklist: - [ x] I have tested this extensively and it does...
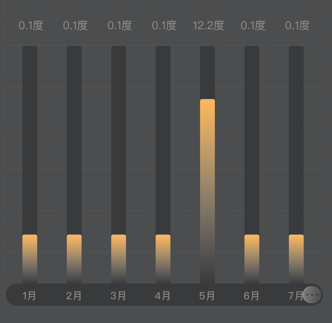
I have the following issue with one of my charts:  The value overlaps the Y Axis label. The "value" text size was increased for better readability but caused this...
## PR Checklist: - [ ] I have tested this extensively and it does not break any existing behavior. - [ ] I have added/updated examples and tests for any...
I have a horizontal chart, I use the mpandroidchart library to draw it: 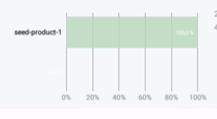 I need my Xaxis top to have different data from my Xaxis bottom. Does the library...
 In addition, how to modify the text spacing on the bar chart? Can I set rounded corners for bar graphs? Thank you for your answer
I have drawn image resource onto line graph data point but I need the image icon to be drawn above data point so that it shows data point value as...