Different values for Xaxis: MPANDROIDCHART
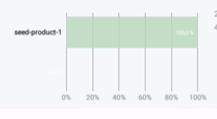
I have a horizontal chart, I use the mpandroidchart library to draw it:
I need my Xaxis top to have different data from my Xaxis bottom. Does the library support this?

my code
       `val xAxis = barChartHorizontalProduct.xAxis
        xAxis.setDrawGridLines(false)
        xAxis.granularity = 1f
        xAxis.isGranularityEnabled = true
        xAxis.position = XAxisPosition.BOTTOM
        xAxis.textSize = 8f
        xAxis.setDrawAxisLine(false)
        xAxis.xOffset = -8f
        xAxis.valueFormatter = IndexAxisValueFormatter(label)


        val test = arrayOf("test1", "test2", "test3")
        val xAxisTop = barChartHorizontalProduct.xAxis
        xAxisTop.valueFormatter = IndexAxisValueFormatter(test)
        val position = XAxisPosition.TOP
        xAxisTop.position = position`
I don't know if I understand you correctly or not But you can customize how to render XAxis and their number by overriding the drawLabel method in XAxisRenderer.
add this java class :
public class MahdiXAxisRenderer extends XAxisRenderer {
   public MahdiXAxisRenderer(ViewPortHandler viewPortHandler, XAxis xAxis, Transformer trans) {
       super(viewPortHandler, xAxis, trans);
   }

   @Override
   protected void drawLabel(Canvas c, String formattedLabel, float x, float y, MPPointF anchor, float angleDegrees) {
       String line[] = formattedLabel.split("\n");
       try {
           Utils.drawXAxisValue(c, line[0], x, 0 , mAxisLabelPaint, anchor, angleDegrees);
           Utils.drawXAxisValue(c, line[1], x, y, mAxisLabelPaint, anchor, angleDegrees);
       } catch (Exception e) {
           Utils.drawXAxisValue(c, line[0], x, 0 , mAxisLabelPaint, anchor, angleDegrees);
       }
   }
}
then add this XAxisRenderer to your chart :
barChartHorizontalProduct.setXAxisRenderer(
                CustomXAxisRenderer(
                    weeklyBarChart.viewPortHandler,
                    weeklyBarChart.xAxis,
                    weeklyBarChart.getTransformer(YAxis.AxisDependency.LEFT)
                )
            )
with this you can have two xAxis with different data . in your labels data seprate top xAxis data from bottom xAxis data with "\n"
example :
  label data -> [
  "Ana\n204"
  ]
so : line[0] = "Ana" and line[1] = "204"
first xAxis with "Ana" value draw in y = 0 (top) and second xAxis with "204" value draw in y = y (bottom of chart)
I'm sure you can pass data to Renderer without the "\n" separator. Good luck :)