GPUProfiler
 GPUProfiler copied to clipboard
GPUProfiler - Understand your application and workflow resource requirements
Hey Jeremy, Trying to run the conversion tool and running into an error. When we target either a single file or batch the same error occurs. I get a read...
A common request to capture an application(s) or desktop render rate.
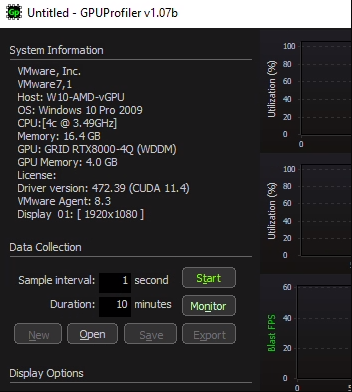
Current GPUProfiler versions do not provide enough information about AMD CPU types as seen in this test on an AMD EYPC system. 
Adding these additional data points Performance State Current power draw GPU temperature Fan speed These will be displayed within the value inspector above the utilization metrics ``` GPU-name P8 220W...
A button to show or hide all of the GPU clock details in the graph, clock information will remain available to view in the data inspector
If you have a lot of logical cores it is difficult to see the overall CPU utilization and should be an optional display item. Adding a separate display toggle will...
Capture and stores the Graphics, SM, Memory and video clocks. Purpose is to confirm overall GPU clock rates during application use, encode or decode streams, etc. Capture and serialization work...
Current versions only compute histograms for the first GPU, now that CPU/RAM and other non-GPU graphs have been isolated it will be easier to compute and display the histogram information...
Purpose is to identify when application CPU utilization is limited to a single core.
Adding the remoting protocol metrics for Network Tx/Rx and packet loss information. HDX, PCoIP and Blast support. Request for details about TGX, RDP if anyone has data sources I can...
