framework

framework copied to clipboard
Order of visualization legend changes when changing the visualization format
Describe the bug When you open a report that has been saved as a line chart and then switch the visualization to say a table and then back, the order of the items in the legend is changed. Depending on the report some legend items might be missing.
To Reproduce Steps to reproduce the behavior:
- Go to Yavin's demo page
- Click on the Coin counts report
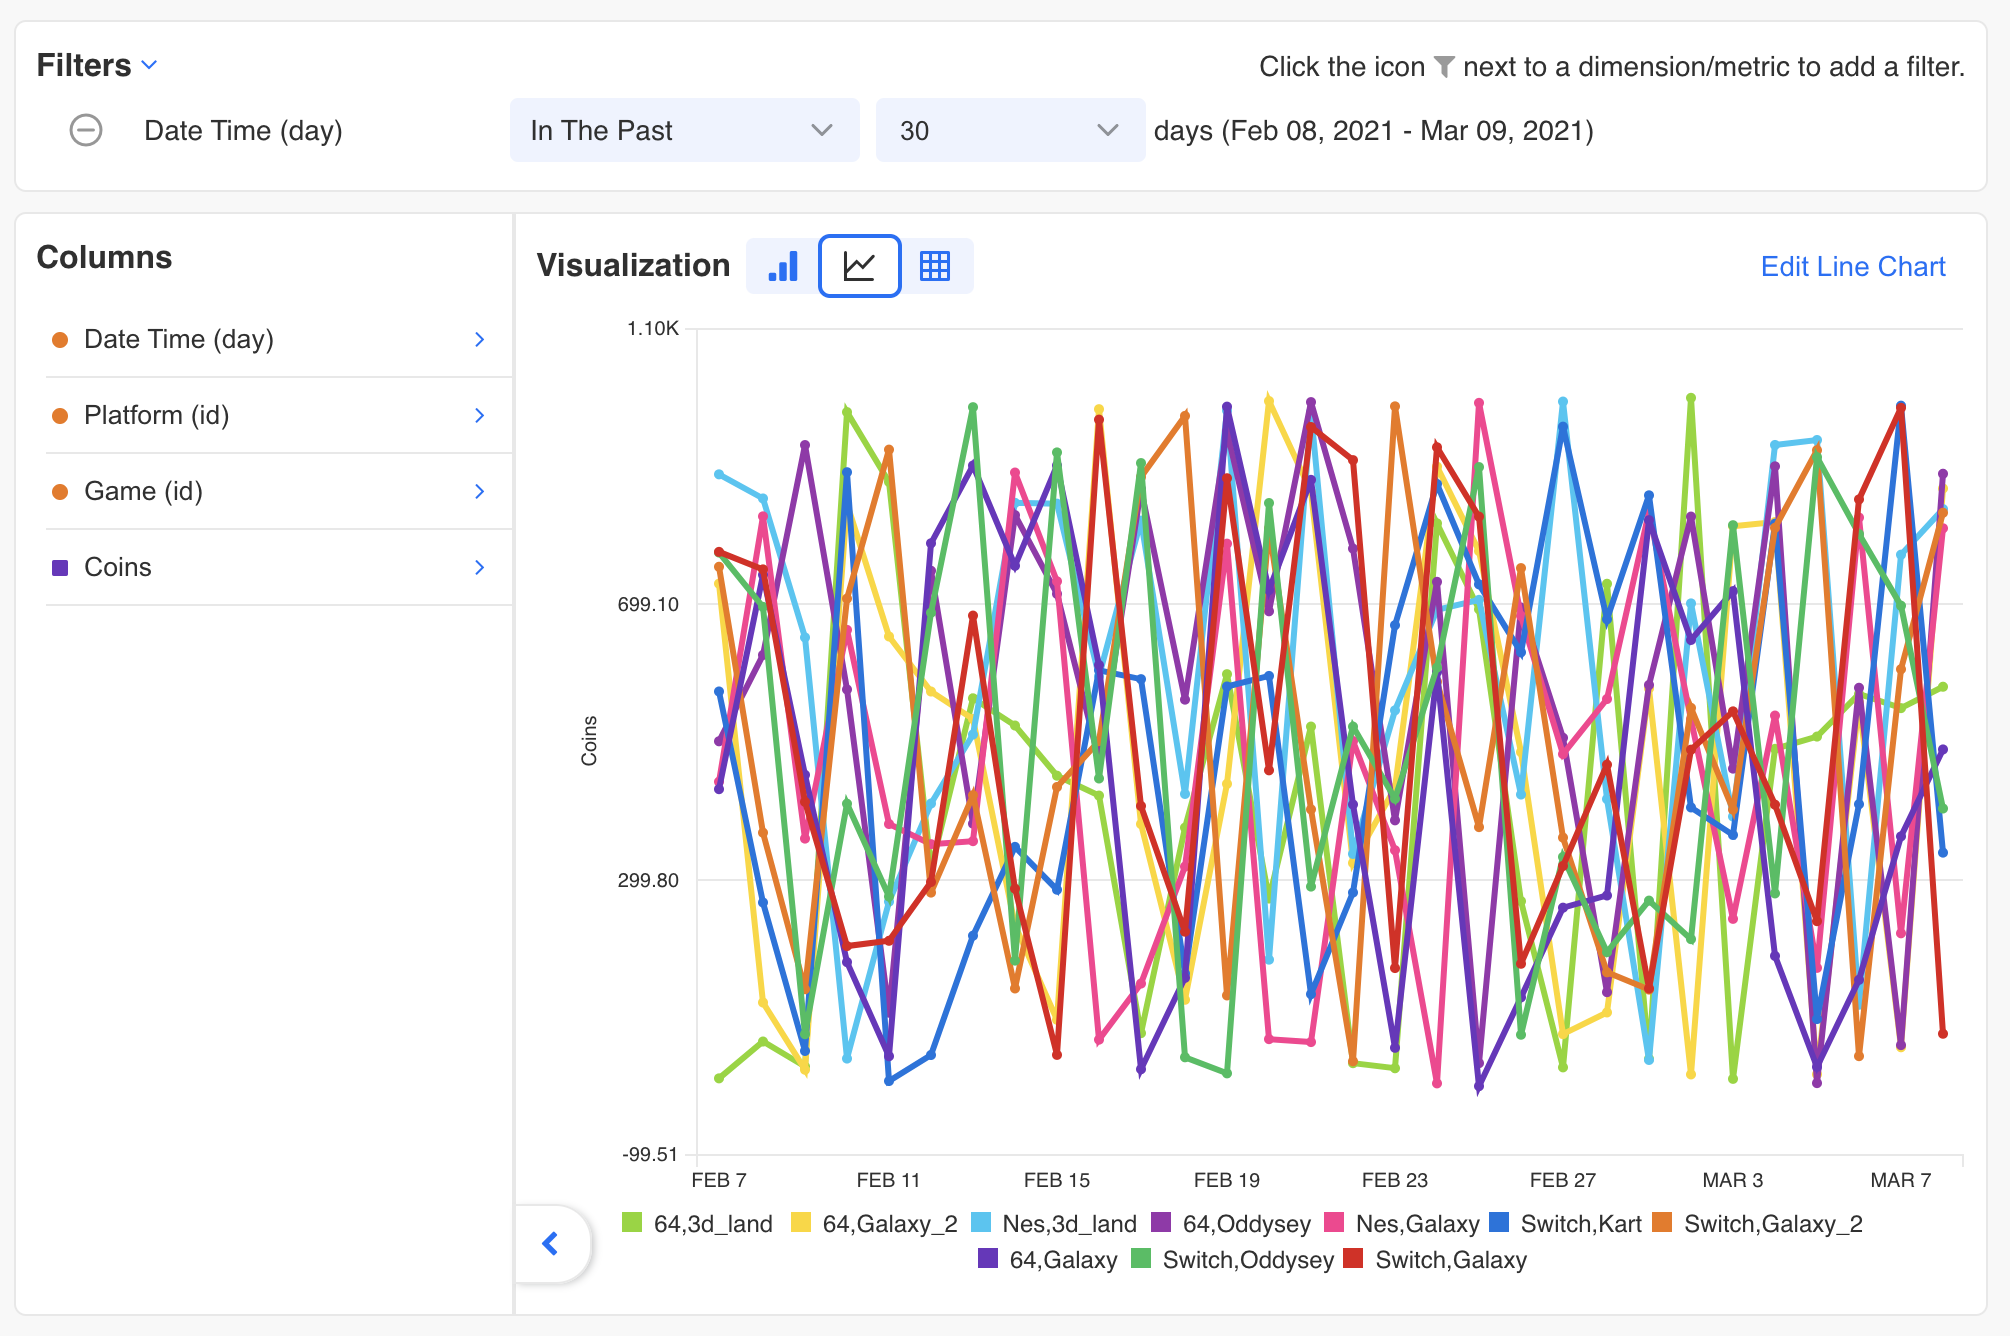
- Notice the items in the legend
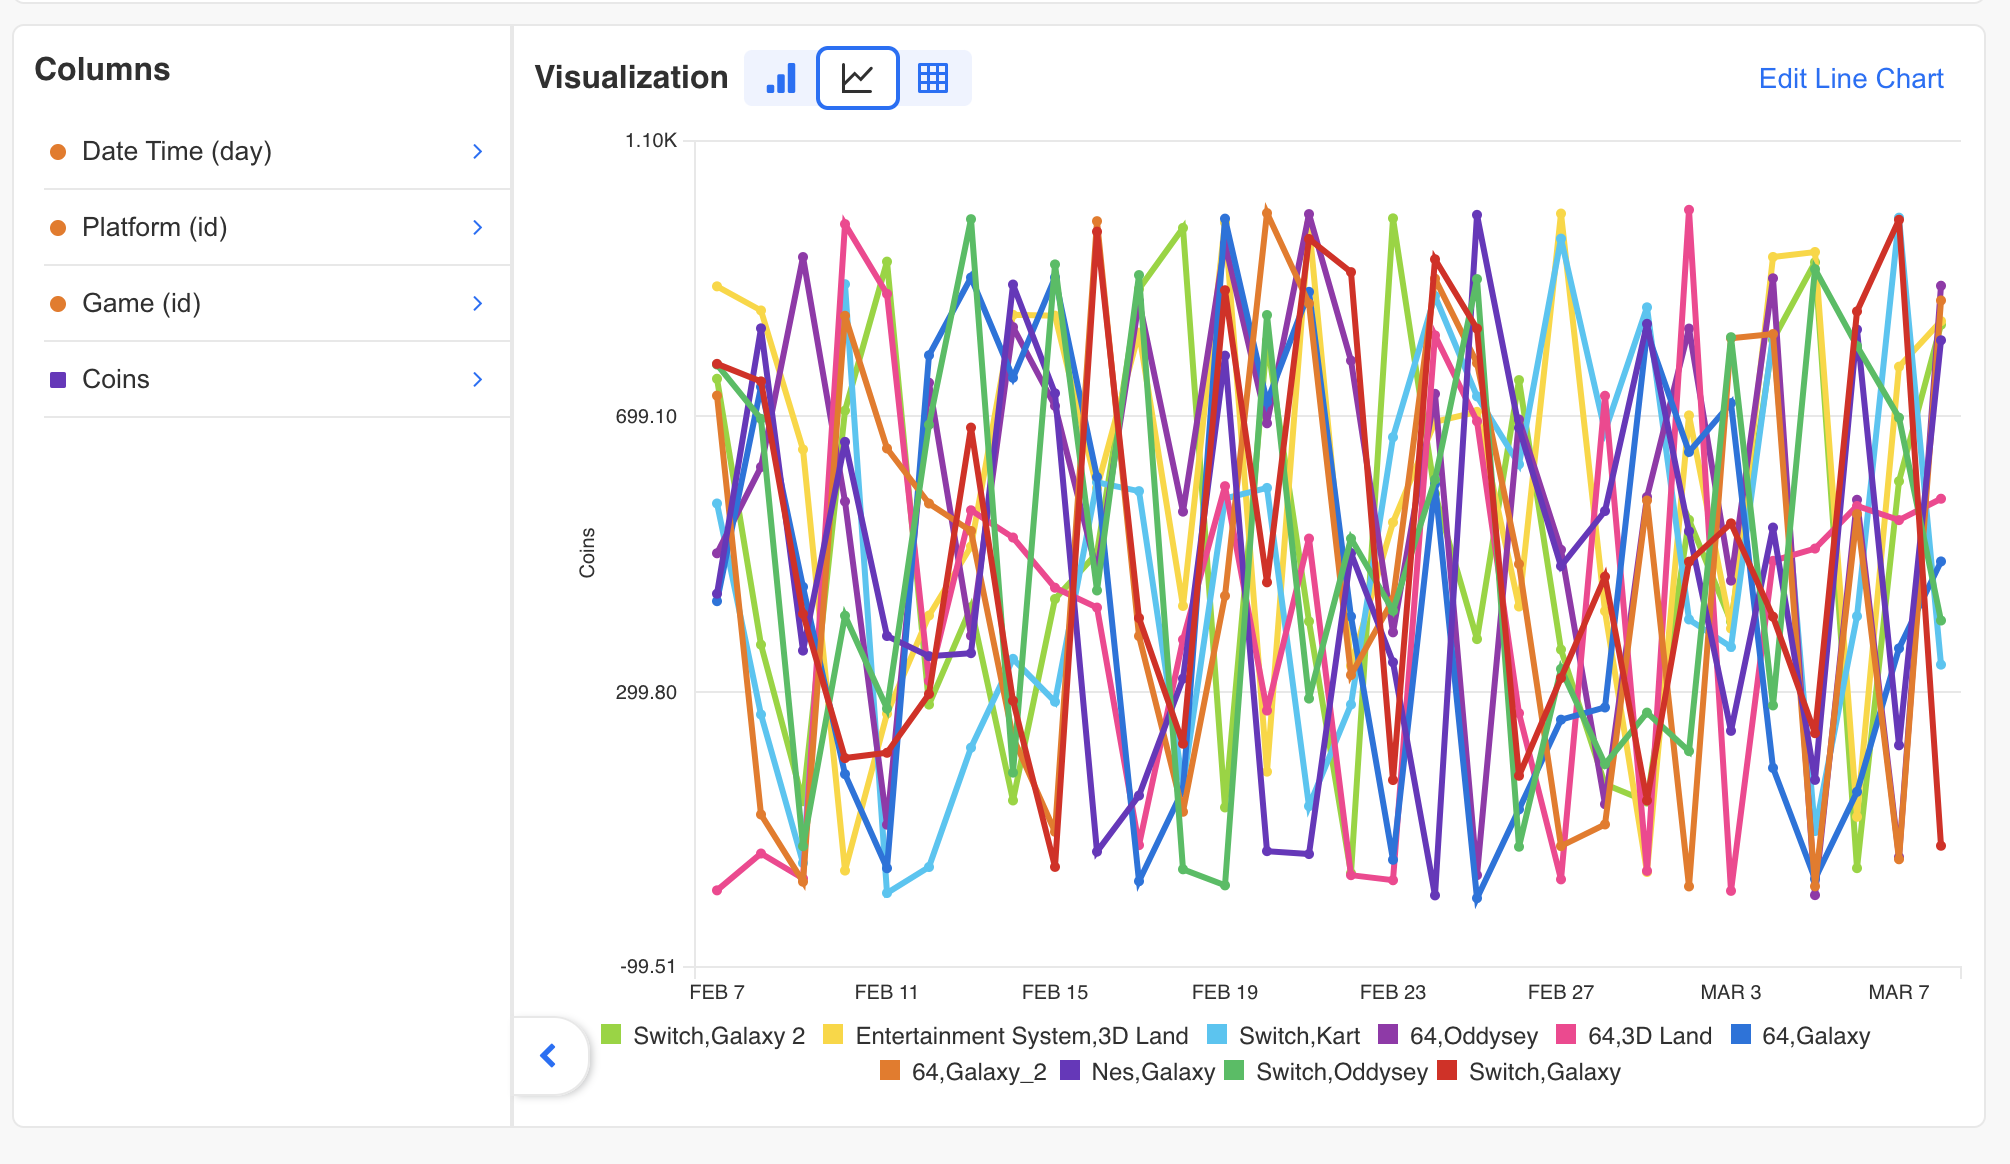
- Change to table view and then back to line chart again
- The order of the items has changes, some items might be missing
Expected behavior The items in the legend remain the same when you switch visualization formats.
Screenshots
If applicable, add screenshots to help explain your problem.