Call Stack bounces when short-lived second requests start/stop
PHP version: 7.3.11 Xdebug version: v2.7.2 VS Code extension version: 1.14.12
When using the PHP debugger I have a request paused and awaiting, however while that request is running other requests are also running but not pausing, as expected. The problem is that while there is only one request in the call stack, the call stack for the paused request is expanded, however when a second request is running the paused call stack gets collapsed and it shows two requests, with the paused request having an expansion arrow. Then the second request ends and the call stack again shows the full single request's call stack. Because of the nature of the application and my local dev environment, this is constantly happening, and focusing on anything or expanding it doesn't prevent me from losing my place.
Possible solutions
- Don't have a different method of displaying a single request in the call stack, always have them as a collapsible item.
- Don't show running requests. Is there any reason to show that a php request is running if it hasn't paused on a breakpoint?
Hi! I don't think I have a way to influence this. It's just how VS Code presents the data it's sent from the Debug Adapter. However I'm implementing an alternative way of presenting simultaneous Xdebug sessions to VS Code. This is the branch: https://github.com/xdebug/vscode-php-debug/tree/feat/multi-session-debugging It's a bit dated, I can get it up to latest code and attach a VSIX package. Would you be willing to test it?
Sure, I actually originally posted this as an issue with vscode but they said to post it with the extension.
https://github.com/microsoft/vscode/issues/122775
Here's my issue with images.
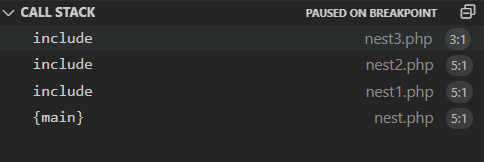
Paused on a breakpoint and looking at a script in the stack.

All of a sudden another request is running, if it's short enough it never does anything and everything is fine.
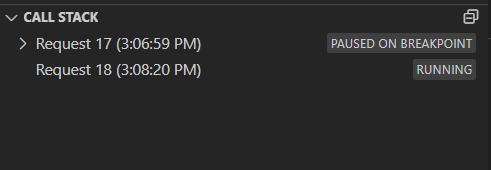
Second request ends, it was never interacted with but lost place in stack trace.
I can get it up to latest code and attach a VSIX package. Would you be willing to test it?
You don't need to send it as a package, just let me know when the code is ready and I can check out the branch and debug it.
I just tested the debugger without the line https://github.com/xdebug/vscode-php-debug/blob/99fc9f31dd9f1101ed53d4426571997a04241336/src/phpDebug.ts#L306
this.sendEvent(new vscode.ThreadEvent('started', connection.id))
and things seemed to work fine. Not sure if it matters that thread events need to be sent, or maybe this could be configured via a setting if it is something some people might care about.
I can get to my PC right now so perhaps you can just try to compile that other branch and try it. I think it should work.
Regarding the event, it is there to display the new “thread”. It could be delayed until a breakpoint, but the problem would remain - it just wouldn’t be that annoying...
Checked out and compiled, but that didn't seem to fix the issue, in addition when the second thread is resumed/completed the original paused thread disappears from the debugger but doesn't seem to complete, so I believe there are more bugs to be worked out.
When I commented out the started ThreadEvent, I saw no issue when the request reached a breakpoint, it still stopped and showed up on the thread list with the stack trace. You do have the running threads stored in the _connections variable, however until the thread can be interacted with, I don't know that it needs to be registered. with the UI. (especially since xdebug doesn't support pausing running requests)
Hi! I fixed the bug, however you were not running the extension the right way - my fault. Without going to deep do the following:
In the project select "Launch Extension" not "Debug adapter". When you get the testproject instance, comment out "debugServer" from launch.json. This way the adapter will be run inside the Extension not as a standalone adapter.
You should see something like this:
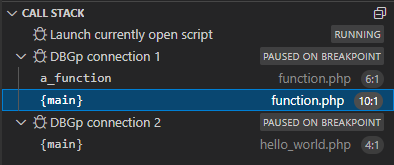
This is all very experimental.
That did the trick.
Despite it being out of scope for this issue, in case it is not expected, when I try and "Restart" a single DBGp connection session I get a notification "Can't find connection". I'm not sure if that is functionality that can be disabled, or if it just needs to be handled differently, but that's the only issue I ran into while bumbling about.
I do like that I can stop debugging a single request and it doesn't kill the other debugging requests.
That's the idea, to treat separate Xdebug/DBGp connection as separate IDE debug sessions. The problem is it depends on VS Code Extension infrastructure, that other IDEs, that might be using DAP do not have. One example is the neovim: https://github.com/mfussenegger/nvim-dap
This is why I'm trying to architecture it so that it can run in both modes...