High memory usage when upgrading from 0.15.2 to 0.16.1
A note for the community
- Please vote on this issue by adding a 👍 reaction to the original issue to help the community and maintainers prioritize this request
- If you are interested in working on this issue or have submitted a pull request, please leave a comment
Problem
We are running vector 0.15.2 in a kubernetes cluster and primarily sinking data to ES. When we upgrade the version (tried 0.20.1 then 0.18.1 then 0.16.1) we see memory issues. We do not change anything about the configuration, just the version used.
We tried adding more memory, allowing more horizontal scaling, but it's not enough to defeat what feels like a memory leak. Memory per pod is 6gb requested, 12gb limit.
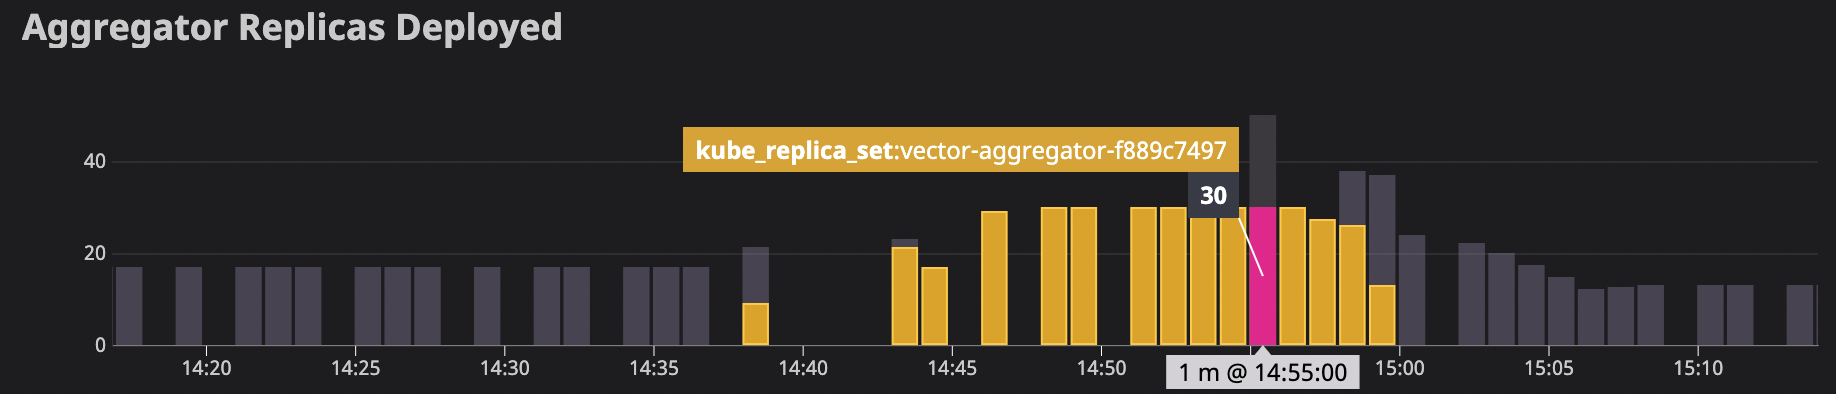
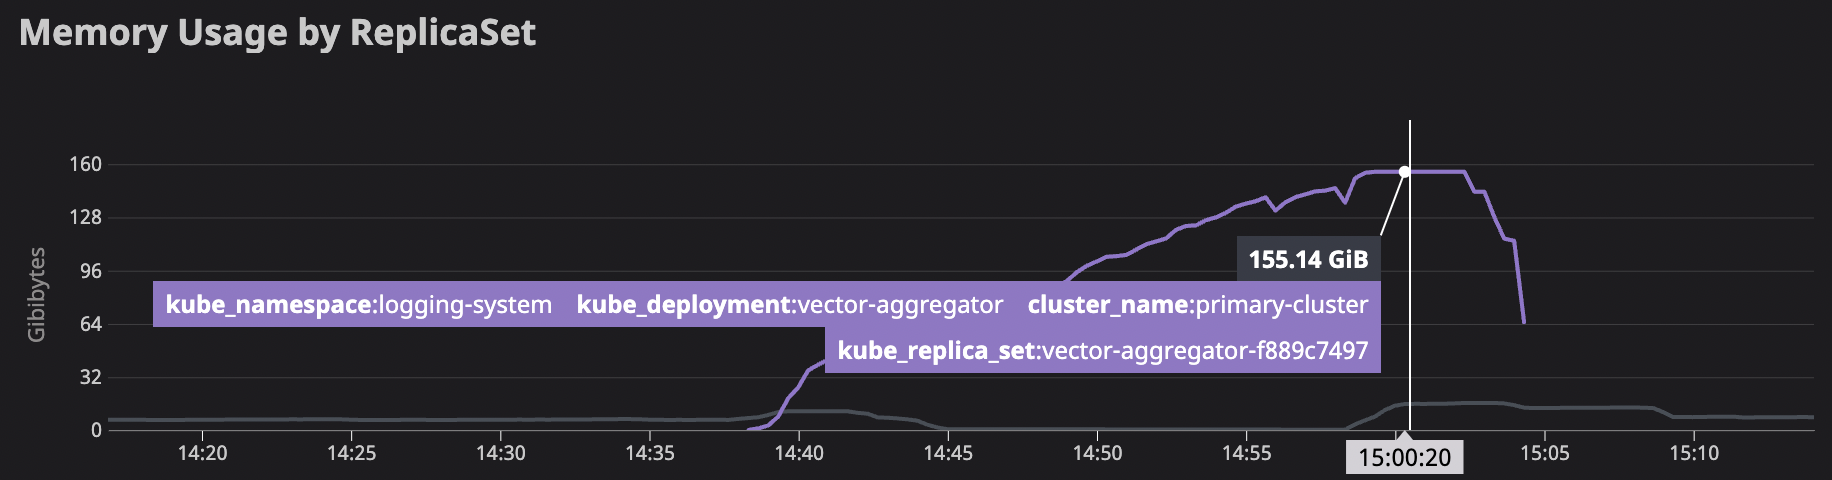
On v15, we are able to successfully handle the pipeline load using 6-10gb on 17 nodes. On v16, memory usage steadily climbs up, k8s scales it up to our max number of configured nodes (30) and memory climbs to 155gb before we reverted.
ES requests also jumped during this time

Looking at logs, we do see a few error messages appearing often, ramping up a few minutes after the deploy:
Aug 31 21:39:06.882 ERROR sink{component_id=elasticsearch component_kind="sink" component_type=elasticsearch component_name=elasticsearch}:request{request_id=5}: vector::sinks::elasticsearch::retry: Response contained errors. response=Response { status: 200, version: HTTP/1.1, headers: {"date": "Wed, 31 Aug 2022 21:39:06 GMT", "content-type": "application/json; charset=UTF-8", "content-length": "1045664", "connection": "keep-alive", "access-control-allow-origin": "*"}, body: b"{\"took\":18354,\"errors\":true,\"items\":[{\"index\":{\"_index\":\"logs-production-006189\",\"_type\":\"_doc\",\"_id\":\"epfX9YIB4dbP_TT2rDk2\",\"_version\":1,\"result\":\"created\",\"_shards\":{\"total\":2,\"successful\":2,\"failed\":0},...

Aug 31 21:43:27.396 ERROR sink{component_id=elasticsearch component_kind="sink" component_type=elasticsearch component_name=elasticsearch}:request{request_id=333}: vector::sinks::util::retries: Not retriable; dropping the request. reason="error type: es_rejected_execution_exception, reason: rejected execution of primary operation [shard_detail=[logs-production-006189][1][P], shard_coordinating_and_primary_bytes=2717005271, shard_operation_bytes=5477155, shard_max_coordinating_and_primary_bytes=2861545665] OR [node_coordinating_and_primary_bytes=3081596553, node_replica_bytes=0, node_all_bytes=3081596553, node_operation_bytes=5477155, node_max_coordinating_and_primary_bytes=3263574835]"
Log graph for es_rejected_execution_exception:

We'd love to look at more of the metrics introduced in later versions, but we are here because we are failing to upgrade.
Configuration
[api]
  enabled = true

[sources.vector_source]
  type = "vector"
  address = "0.0.0.0:5000"
  version = "1"

[sinks.elasticsearch]
  type = "elasticsearch"
  inputs = ["vector_source"]
  endpoint = "${ELASTIC_SEARCH_HOST}"
  index = "alias-write-{{ unsafe.environment }}"
  [sinks.elasticsearch.auth]
    strategy = "aws"
  [sinks.elasticsearch.aws]
    region = "us-west-2"
  [sinks.elasticsearch.buffer]
    max_events = 5_000
    type = "memory"

[sinks.s3_cold_storage]
  type = "aws_s3"
  inputs = ["vector_source"]
  bucket = "<bucket>"
  compression = "gzip"
  content_encoding = "gzip"
  region = "us-west-2"
  content_type = "application/gzip"
  key_prefix = "{{ unsafe.environment }}-{{ unsafe.cluster }}/{{ program }}/date=%F/"

  [sinks.s3_cold_storage.batch]
    timeout_secs = 600 # Flush every 10 min
    max_bytes = 200_000_000 # Flush every 200 MBi

  [sinks.s3_cold_storage.encoding]
    codec = "ndjson"

  [sinks.s3_cold_storage.buffer]
    max_events = 50_000
    type = "memory"


[sources.internal_metrics]
  type = "internal_metrics"
  scrape_interval_secs = 2

[transforms.enriched_internal_metrics]
  type = "remap"
  inputs = ["internal_metrics"]
  source = """
  .tags.pod_name = "${VECTOR_SELF_POD_NAME:-vector_unknown_pod_name}"
  """

[sinks.datadog]
  type = "statsd"
  inputs = [ "enriched_internal_metrics" ]
  mode = "udp"
  address = "<datadog-host>:8125"
  default_namespace = "vector"
Version
0.16.1
Debug Output
No response
Example Data
No response
Additional Context
Vector is running in kubernetes. We are starting vector with /usr/bin/vector --config /etc/vector/*.toml --require-healthy true
Using a docker image built off of the published
FROM timberio/vector:$VERSION-debian
References
Some issues I found that don't appear to be the same (since they are resolved and on earlier versions) but are similar:
- https://github.com/vectordotdev/vector/issues/1496
- https://github.com/vectordotdev/vector/issues/2356
- https://github.com/vectordotdev/vector/issues/7246
- https://github.com/vectordotdev/vector/issues/6673
Thanks for this report @mjperrone . Out of curiosity, I wonder if you still see this on latest (0.24.0)?
One guess I have is the change to the request concurrency behavior in 0.16.0 to be adaptive:
https://vector.dev/highlights/2021-08-20-rate-limits/
This could cause the sinks you have to be using more memory due to issuing more concurrent requests. To verify that, you could set static rate limits that mirror the rate limits in 0.15.0. This would be setting:
request.concurrency = 5
request.rate_limit_num = 5
request.rate_limit_duration_secs = 1
on both the elasticsearch and aws_s3 sinks.
If that doesn't resolve it, and you feel motivated, you could try to bisect down the nightly builds to see the first one that exhibits the new behavior. That would narrow it down to a set of commits that we could review to see if any are suspect which could expedite a resolution here. The nightly builds are tagged like timberio/vector:nightly-2022-08-20-debian. For 0.15 to 0.16 the dates would be 2021-06-16 through 2021-08-25.
Thanks for this report @mjperrone . Out of curiosity, I wonder if you still see this on latest (0.24.0)?
We can't get to latest without first stopping at v20ish to coordinate a zero downtime switchover to the next protocol version if I'm understanding that correctly.
We will try the concurrency after the long weekend and report back. I am hopeful that config change is sufficient, but if not, we may be able to do the bisect.
The vector v1 protocol is still available in all the versions. What is required as of version 0.20.0 is that it now requires you to explicitly name the version, which previously defaulted to v1.
The vector v1 protocol is still available in all the versions. What is required as of version 0.20.0 is that it now requires you to explicitly name the version, which previously defaulted to v1.
If that is true you may want to correct the page I linked that says:
In 0.22.0 we’ll drop v1 completely, and default to v2. We will also no longer require you to explicitly set the version since there will only be one supported going forward.
We added:
  [sinks.elasticsearch.request]
    concurrency = 5
    rate_limit_num = 5
    rate_limit_duration_secs = 1

  [sinks.s3_cold_storage.request]
    concurrency = 5
    rate_limit_num = 5
    rate_limit_duration_secs = 1
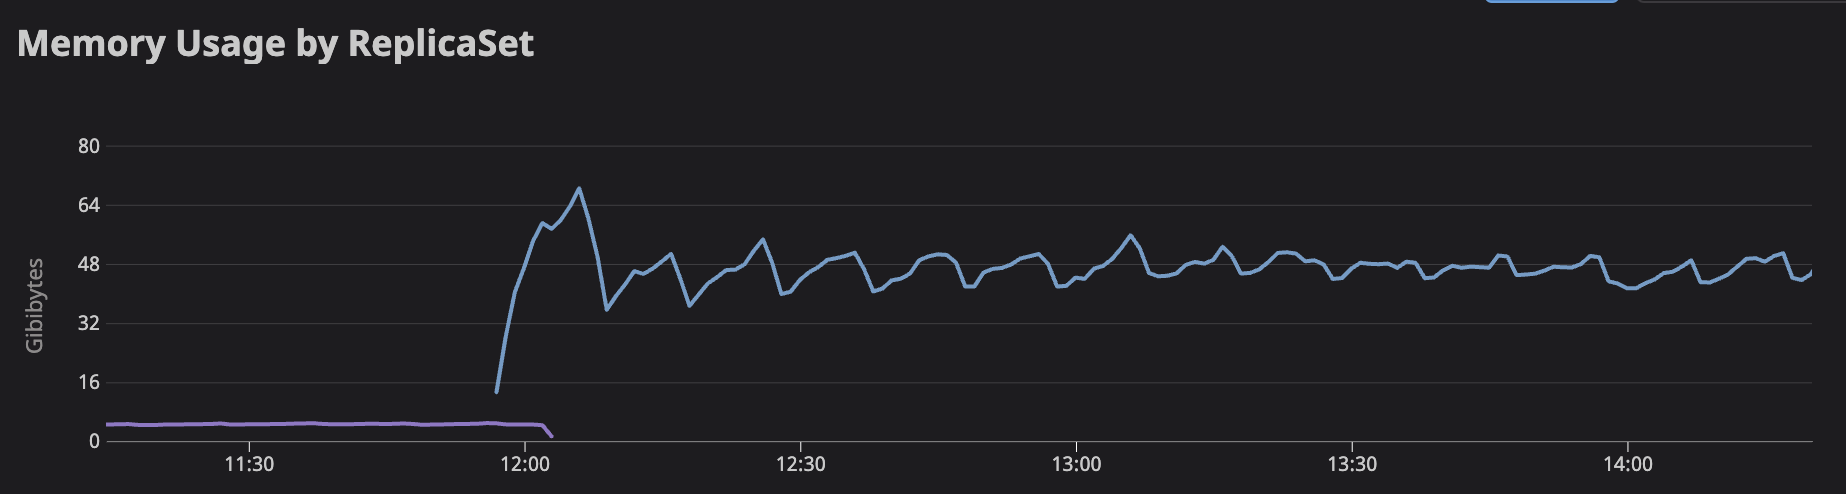
This allowed us to get to v16 and all the way through to v24 without having as severe OOM issues. The newer versions are definitely using a lot more memory though:
 s.
s.
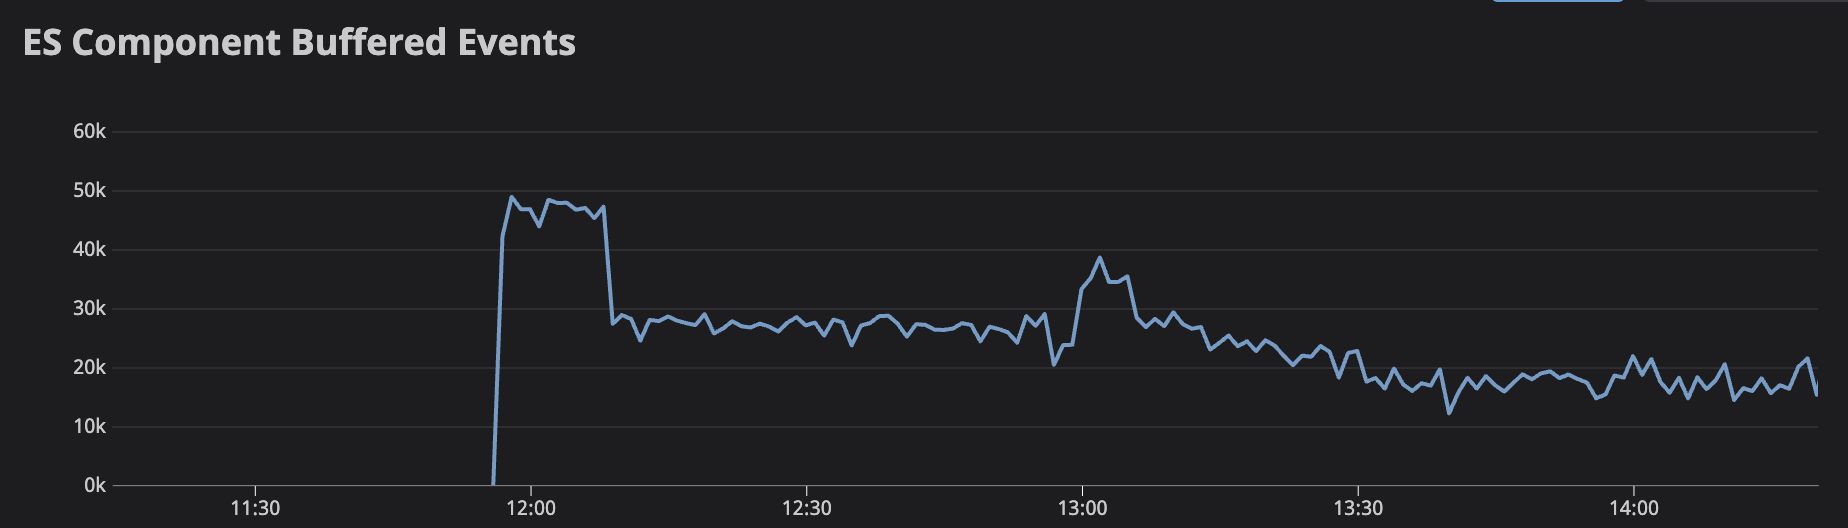
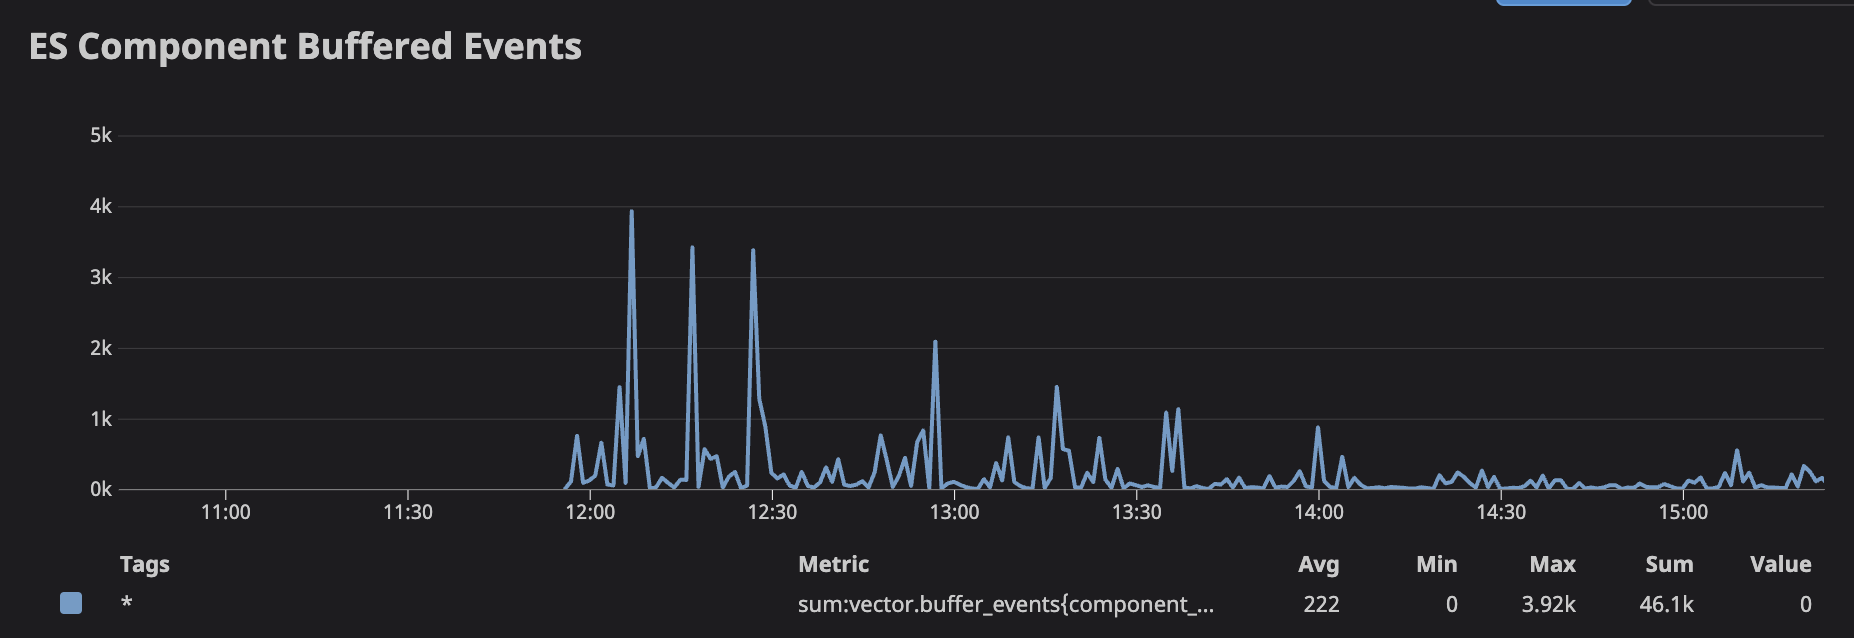
Is it expected that the newer versions are using significantly more memory? Each log event is about 1kb for us, so having ~60k events in the ES buffer should mean ~60mb in the buffer, but we're seeing ~60gb in the buffer.
If that memory isn't coming from the buffer, then is there a good way to see why that much memory is being used?
Hmm, yeah, that is a significant difference. Is that graph going from 0.15 to 0.16? If so, I think we may want to try the bisecting of nightlies I mentioned above to narrow down the range of commits that could be affecting it. Would you be open to that?
As far as seeing where memory is being used in Vector, the best approach at this point is to run Vector under a profiler like Valgrind. If you are able to do that and provide the profile that could be illimunating. We've started some work to improve the ability to see where memory is being allocated in Vector with https://github.com/vectordotdev/vector/pull/11109 but that is still a WIP.
Is that graph going from 0.15 to 0.16?
Yes.
We may be able to prioritize bisecting the nightlies or try to run vector with Valgrind. Thank you for the suggestions.
Do you have an example set of commands for running vector with valgrind? I don't have experience with that but at first glance it looks like it says it's for c++ programs though vector is in rust.
Great! I'm curious to see what you find.
For valgrind, at its most basic, it'd be something like: valgrind --trace-children=yes --tool=massif vector --config /path/to/config.toml. You can let it run for a bit and then ctrl-c it to have it spin down and dump the profile as a file on disk, which we can then visualize.
By the way, if valgrind for some reason will not work for you, you could try other tools from here: https://nnethercote.github.io/perf-book/profiling.html From my side I can recommend heaptrack - it should work with a Rust-based programs like Vector.
I was able to spend some time trying to profile a single pod, I didn't get useful results but maybe someone can help me with that. I tried valgrind and heaptrack. I think I may need a vector compiled in debug mode but I don't see any debug builds here. Is there a debug image published? Or do I need to build it myself from source in order to run the profiler successfully?
Valgrind
apt-get install -y valgrind
valgrind --trace-children=yes --tool=massif /usr/bin/vector --config "/etc/vector/*.toml" --require-healthy true
yields this error
/build/heaptrack-RX4CIj/heaptrack-1.2.0/src/interpret/heaptrack_interpret.cpp:351 ERROR:Failed to create backtrace state for module /usr/bin/vector: unrecognized DWARF version in .debug_info at 2533446 / Success (error code 0)
Heaptrack
Using heaptrack on the already running process
apt-get install -y procps heaptrack gdb
ps auxwww | grep vector
heaptrack --pid 1
yields this error:
heaptrack output will be written to "//heaptrack.vector.10562.gz"
injecting heaptrack into application via GDB, this might take some time...
injection finished
/build/heaptrack-RX4CIj/heaptrack-1.2.0/src/interpret/heaptrack_interpret.cpp:351 ERROR:Failed to create backtrace state for module /usr/bin/vector: unrecognized DWARF version in .debug_info at 2533446 / Success (error code 0)
Segmentation fault (core dumped)
removing heaptrack injection via GDB, this might take some time...
'heaptrack_stop' has unknown return type; cast the call to its declared return type
Heaptrack finished! Now run the following to investigate the data:

  heaptrack --analyze "//heaptrack.vector.10562.gz"
and an empty file at heaptrack.vector.10562.gz.
Starting vector with heaptrack
heaptrack /usr/bin/vector --config "/etc/vector/*.toml" --require-healthy true
Yields this error:
/build/heaptrack-RX4CIj/heaptrack-1.2.0/src/interpret/heaptrack_interpret.cpp:351 ERROR:Failed to create backtrace state for module /usr/bin/vector: unrecognized DWARF version in .debug_info at 2533446 / Success (error code 0)
Hello, I wanted to also add to this issue with what we are currently seeing in our production environment with the hope it might help. Will try to post our config tomorrow if it helps
Background
- Vector version: 0.13.1 -> 0.23.2
- running in ECS (dev has 1gb of memory .5vCPU)
- Using vector to receive syslog messages and send them to our elasticsearch
changes we made for upgrading
- Added logstash source
- Added a route for logstash source to filter out different beats(filebeat,metricbeat,auditbeat,etc)
- Added an elasticsearch sink for these beats(only sending auditbeat to start)
Our vector config is pretty simple so we decided to upgrade all the way to 0.23.2. After the upgrade, we saw the same behavior with memory spiking and crashing our environment. The odd thing was it immediately started spiking before we started sending auditbeat messages to vector. So to start we removed the changes made and still saw the spike. So after that I saw the same message relating to the request. concurrency changing from 5 to 1024 so we did a quick config change on the sinks to set it back to 5 however we still saw the spike. After this we reverted all changes and moved back to version 0.13.2.
testing
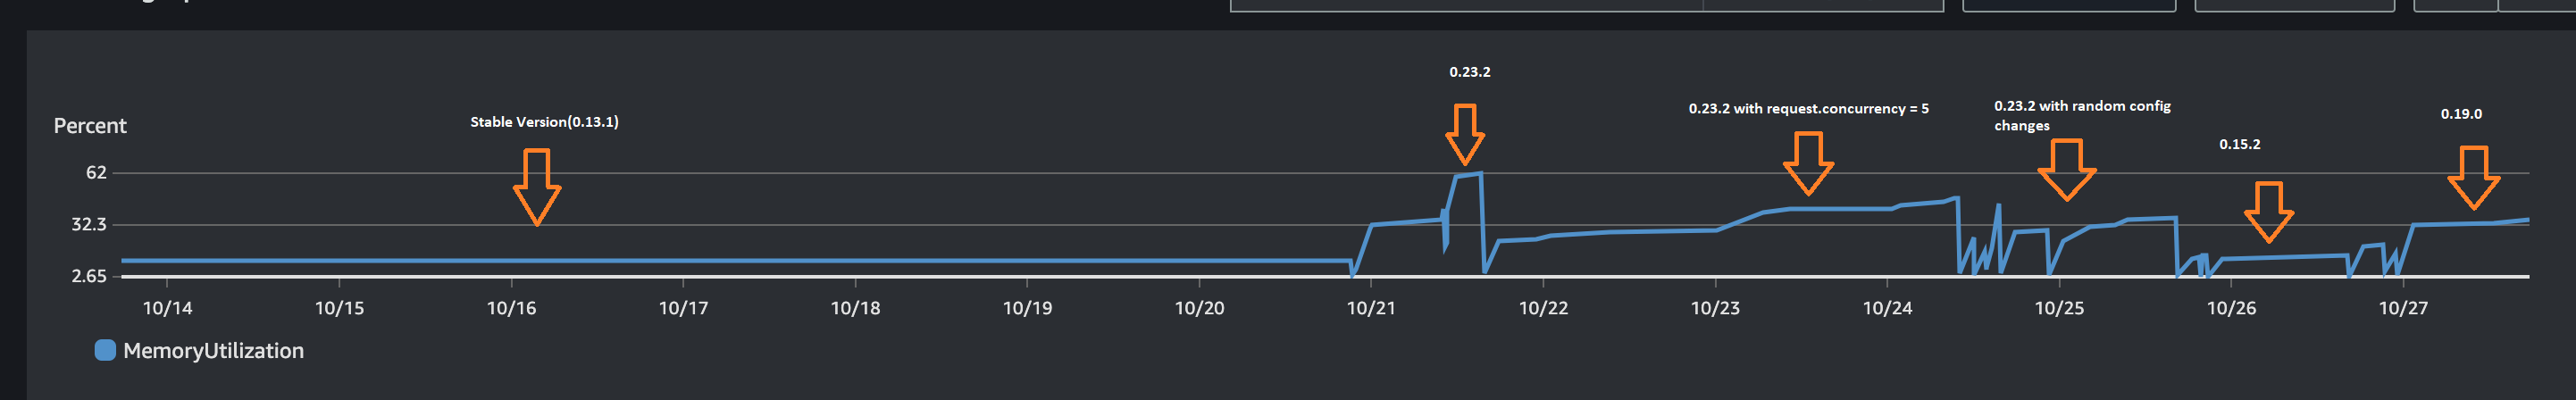
After prod was healthy I went to our dev environment to do some testing to try and narrow down the problem. Below will be a graph of the memory spikes over a week and some points relating to the versions being used.
- Base: version 0.13.1 (no logstash source) 11% memory and stable
- version 0.23.2 with request.concurrency = 5 with logstash source. Immediately noticed the environment start to spike with no end. spiked all the way to 62% before autoscaling spun up another task.
- Version 0.15.2. Changed to this version with the same config and request.concurrency = 5. Memory was stable at around 13%. without logstash and 20% with logstash.
- Version 0.19.2. Saw a bigger spike than 0.15.2 however unlike 0.23.2 the memory stayed stable at around 30% and has gone up about 1% with more load.
Todo/Summary
- As I went from 0.13.1 -> 0.15.2/0.19.0 we saw spikes in memory however memory did not continue to spike and leveled out unlike 0.23.2.
- Going to try and upgrade to 0.20.0 as I need one of the fixes in parse_groks and see if I see a stable memory load or if it spikes similar to 0.23.2.
- Figure out which version causes what appears to be a memory leak.