Incomprehensible overhead in Tritonserver inference
Description
There are two strange experimental results regarding the performance of Tritonserver that I cannot understand.
Experiment 1
There is a "huge" difference between the performance of local inference and that of the Tritonserver inference.
Tritonserver is much slower and the HW resources (e.g., CPU, GPU, NIC) are very low-utilized with Tritonserver. I want to know what the major cause is. I tested a tensorRT-optimized resnet50 on two systems: local inference and Tritonserver inference. Both of them run the NN GPU computation without JPEG pre-processing. The followings are the details with some Nsight profiled results.
-
Local inference: running the resnet50 model with trtexec (no network operations). It shows the performance of 30k infer/sec (which might be the ideal performance of Tritonserver). The GPU is fully utilized as there are no gaps between the consecutive GPU kernel launches.
-
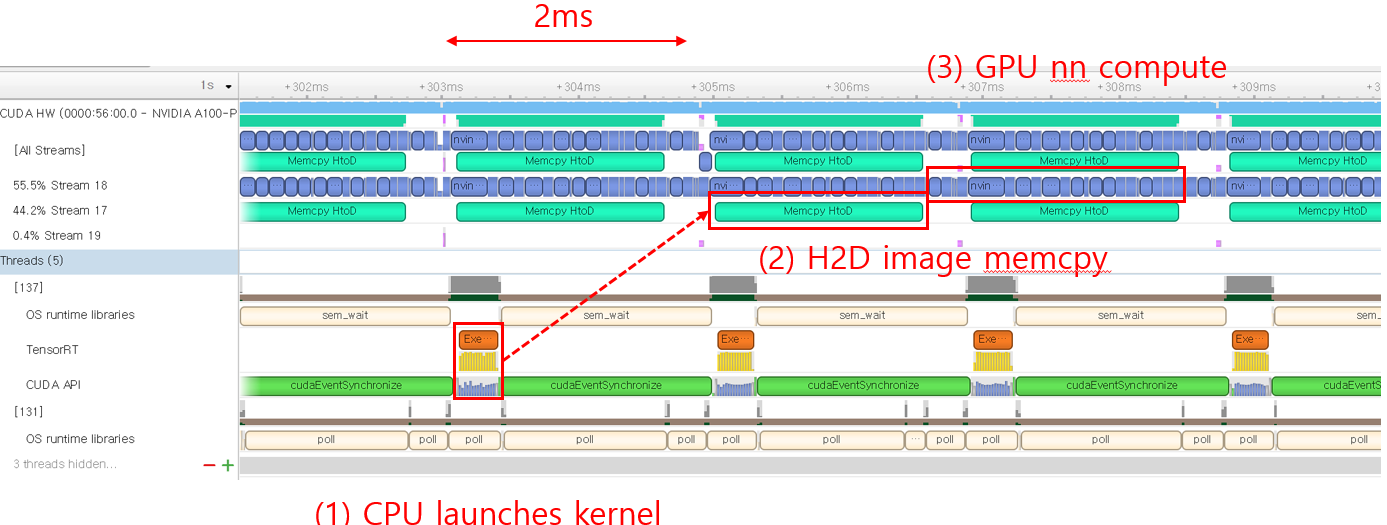
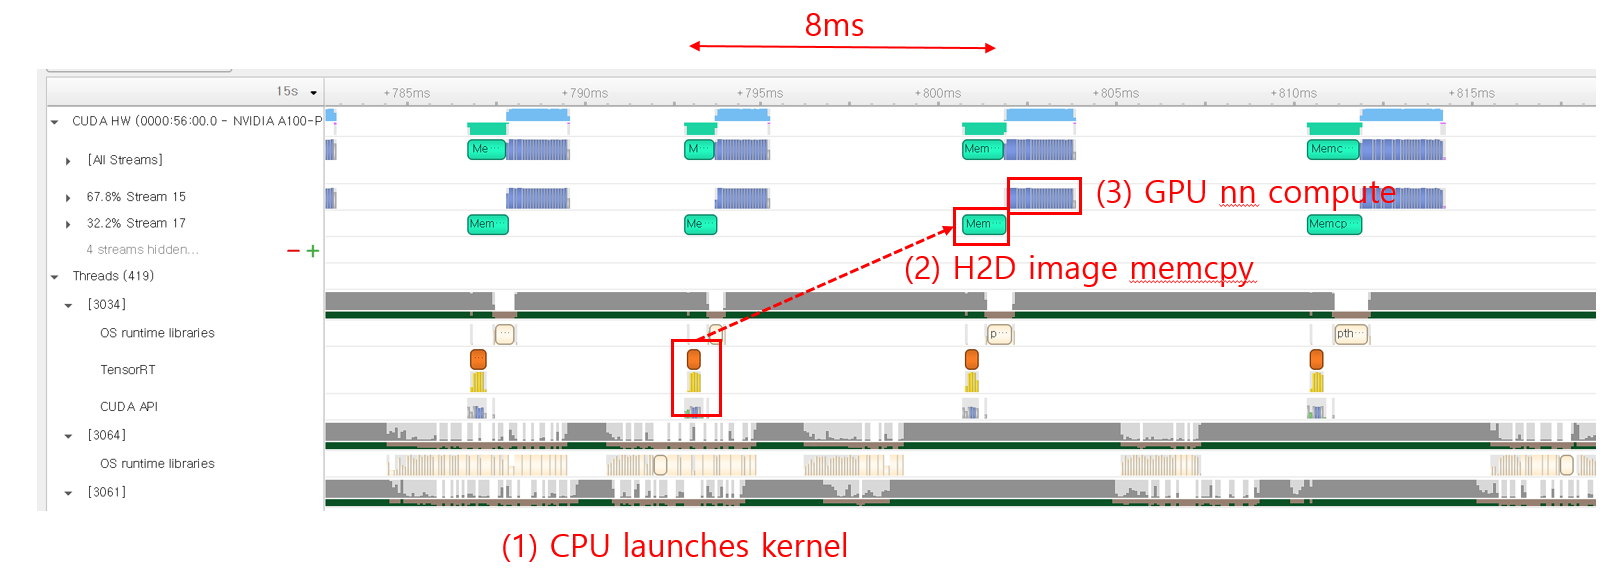
Tritonserver inference: running perf_analyzer to send gRPC inference requests to the Tritonserver hosting the resnet50 model. Tritonserver only achieves 6k infer/sec. The GPU is not fully utilized as there are long gaps between the GPU kernel launches.
< triton result with perf_analyzer >

  Client:
    ....
    Avg gRPC time: 48261 usec ((un)marshal request/response 545 usec + response wait 47716 usec)
  Server:
    Inference count: 111631
    Execution count: 1618
    Successful request count: 111631
    Avg request latency: 35700 usec (overhead 2878 usec + queue 18218 usec + compute input 12250 usec + compute infer 2234 usec + compute output 119 usec)

Inferences/Second vs. Client Average Batch Latency
Concurrency: 300, throughput: 6190.94 infer/sec, latency 48288 usec
Expected behavior
Since there are plenty of the CPU/NIC resources for Tritonserver, it should also fully utilize the GPU and show near ~30k performance (like local inference).
Question 1. What is the bottleneck? Tritonserver is not fully utilizing the CPU/NIC resources.
Although there can be a number of overheads (e.g., gRPC), I think 6k is too low (when compared to the 30k) due to the following reasons. First, there are plenty of the computing resources still unused (e.g., CPU, NIC), so there should be more room for more performance improvement. Second, the compute-heavy JPEG pre-processing is not included. Is 6k a reasonable number?
Question 2. Could you give me some details about the result from perf_analyzer?
- I'm guessing that the difference between "Avg gRPC time"(48261 usec) and "Avg request latency"(35700 usec) is the gRPC overhead. Am I on the right track?
- What is the meaning of "queue" and "compute input" in the Avg request latency breakdown? I read the related docs, but still don't understand why they take so much latency. I think there shouldn't be the queueing delay since the GPU does not become the bottleneck at all.
Experiment 2
I cannot understand the result of perf_analyzer with the "--streaming" option.
Following Experiment 1, I performed another experiment with "--streaming" option in perf_analyzer to enhance the gRPC-side performance. The following shows the results of Triton:
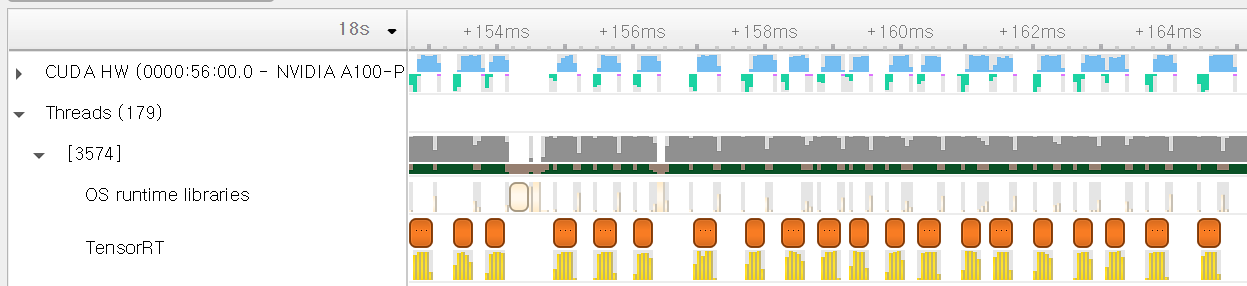
- The long gaps between each GPU kernel launch in Experiment1 have disappeared.
- However, the result with perf_analyzer shows worse performance than that of Experiment 1.
< triton result with perf_analyzer >

  Client:
    ...
    Avg gRPC time: 63631 usec ((un)marshal request/response 99 usec + response wait 63532 usec)
  Server:
    Inference count: 84348
    Execution count: 19836
    Successful request count: 84348
    Avg request latency: 10163 usec (overhead 241 usec + queue 6071 usec + compute input 3213 usec + compute infer 517 usec + compute output 120 usec)

Inferences/Second vs. Client Average Batch Latency
Concurrency: 300, throughput: 4665.47 infer/sec, latency 63636 usec
Expected behavior
gRPC streaming option showing better performance than Experiment 1.
Question 3. Incomprehensible perf_analyzer result
When compared to Experiment 1, "Avg request latency" becomes x4 times lower (queue, input latency decreases a lot). However, the total latency increases from 48288 to 63636. Can I get some hint interpreting this result?
Triton Information
Triton version: 22.07
- Server: from container
- Client: build from source
HW setup
- 64 physical core Xeon CPU
- 100g NIC
- A100 GPU
To Reproduce
Local inference
$ trtexec --iterations=50 --warmUp=10 --duration=3 --sleepTime=0 --streams=1 --shapes=input:64x3x224x224 --loadEngine={my resnet50 model}
Tritonserver inference
Server-side
- I exported the resnet50 model with tensorRT (torchvision pre-trained model -> onnx export -> trtexec). FYI, I referred to the docs/examples/resnet50_trt in the "dali_backend" repo.
- I launched the model with one gpu, dynamic batching ON, batch size of 64, and instance count of 1.
- I did not use any pre-processing plugins (e.g., dali).
Client-side $ perf_analyzer -m {my resnet50 model} --shape input:3,224,224 -i grpc -u 100.0.1.155:8001 -b 1 --concurrency-range 300
Hi @jhm0104666,
Thanks for filing a detailed Github issue. The expectation of Triton's performance when running inferences over the network to match with local inference is wrong. The local inference time is part of the total time that Triton takes to run the inferences. There are the following additional overheads which are not accounted for when running the inferences locally:
- Transferring the inputs with the additional metadata (such as shape, datatype) over the network
- Queueing the inference requests in case there is not any model instance available for execution.
- Copying inputs from CPU to GPU (since you are running the inferences on tensorrt backend)
- Run the inference
- Copy the output from GPU to CPU
- Transfer the output result from the server to the client over the network.
When running inferences with trtexec, you will be only accounting for the time in step 3. If you only want to compare the actual inference time, you can compare the "compute infer" time with trtexec. Having said that there are a few things you can do, to further optimize your inference pipeline:
-
Optimize your model configuration using Model Analyzer: https://github.com/triton-inference-server/model_analyzer Model Analyzer will automatically sweep the model instances and max batch size fields. If the GPU activity is very sparse, increasing the number of instances can help with your model performance.
-
Looks like you are experimenting with extremely high concurrency values. If you are running both perf analyzer and Triton on the same machine, they will be competing for resources which may result in resource saturation. I suggest trying smaller concurrency values. The goal is to keep the queuing time low so that there is enough load to keep the server busy but not too much load that the queuing time is dominating the inference pipeline time.
-
If you are running the server and the client on the same machine you can try the
--shared-memory 'cuda'option when running the perf analyzer. This option will use a memory location shared between Perf Analyzer and Triton server and the profiling scenario will be closer to what you are doing with trtexec.
Regarding the gRPC streaming, I'm not sure why it is resulting in a quarter of time spent in processing the compute input. Do you observe similar result when running with smaller concurrency values?
compute input is basically the time that the backend spends to prepare the inputs for the framework. In the TensorRT backend case, it is mainly copying the inputs from CPU to GPU. The queuing time, is the time that the request spends in the queue before a model instance becomes available for performing inferences.
Hi @Tabrizian,
Thanks for the detailed explanation. Now I understand the difference between trtexec and Triton quite well. Here're the results from the optimization techniques you suggested.
- (parameter sweep) I could not gain larger throughputs than the one with my previous parameters. I guess there's no room for performance improvement with the parameter sweep.
- (low concurrency) I've tested with lower concurrency values; while the queueing delay decreases a lot, I couldn't see any improvements in throughput.
- (gRPC streaming) Yes, I observe similar results with other concurrency values.
Some more questions pop up in my head, which I would like to ask. Before moving on, I would like to clarify that the server and the client apps are running on different servers (sorry that I should've provided more details :( ).
Question 1. Low HW resource utils
I still cannot understand why the throughput stops increasing even if there're plenty of resources left (i.e., CPU, NIC, PCIe, GPU, Mem). Are there any options to increase the HW usage in the Triton stages (i.e., gRPC server worker threads, schedulers) other than "compute input and infer"? The reason that I think those stages are the bottlenecks is that I couldn't get more performance with more GPU instances.
- [update 1] After looking through the source code, I find that the # of "InferHandler" in the gRPC server is fixed to 2. I guess this represents the gRPC worker and should be set larger. Is there any reason for choosing this number?
Question 2. Questions related to MLPerf Inference
The MLPerf inference result (v2.0) from NVIDIA shows that a single A100 with Triton, TensorRT gets ~20k resnet50 performance in the "server scenario". Can you give me some hints on how they did this? FYI, I applied many approaches similar to the ones in the MLPerf report (e.g., tensorRT int precision, no pre-process), and achieved ~7k performance.
Question 3. Misc
- Can you tell me the meaning of the batch size in the perf_analyzer? I thought it is the #image in a single gRPC request call and increasing the batch size can also increase the load to the Triton backend. If so, I think the test with {"N" concurrency, "B" batch} and the test with {"N x B" concurrency, "1" batch} should show similar throughput results. Am I on the right track?
- I guess that the MLPerf server scenario is similar to the perf_analyzer with batch size "1". Is this correct?
(parameter sweep) I could not gain larger throughputs than the one with my previous parameters. I guess there's no room for performance improvement with the parameter sweep.
Can you share the Model Analyzer summary report?
I still cannot understand why the throughput stops increasing even if there're plenty of resources left (i.e., CPU, NIC, PCIe, GPU, Mem).
Increasing the number of model instances is the way to tackle this problem if you think there are additional resources left on your machine.
[update 1] After looking through the source code, I find that the # of "InferHandler" in the gRPC server is fixed to 2. I guess this represents the gRPC worker and should be set larger. Is there any reason for choosing this number?
@GuanLuo can you comment on this? Can you try your experiments with HTTP endpoint too? The http endpoint has a http-thread-count parameter that might be helpful in your scenario. This would rule out whether the frontends are the bottleneck for your inference pipeline.
Question 2. Questions related to MLPerf Inference
The numbers report in MLPerf mostly use the Triton C-API. If you want to get closer to those numbers, I suggest you retry your experiments with Perf Analyzer C-API.
Can you tell me the meaning of the batch size in the perf_analyzer? I thought it is the #image in a single gRPC request call and increasing the batch size can also increase the load to the Triton backend. If so, I think the test with {"N" concurrency, "B" batch} and the test with {"N x B" concurrency, "1" batch} should show similar throughput results. Am I on the right track?
No. When you set the PA batch size to "b", it will create a single request whose batch size is "b". However, if you create a "b" requests with batch size of 1, the backend must concatenate these requests into a single contiguous buffer and scatter the single response buffer into individual response buffers. That is why I think it is hard to expect the performance numbers you were describing.
Creating 2 InferHandler is just an empirical decision base on experiments and GRPC performance guide.
Adding a point on Q1, as Iman mentioned, you should experiment with more model instances to achieve higher utilization. The reason being that in serving scenario, there are additional overhead other than compute itself as Iman explained. So even if the model instance is being executed back-to-back, the ratio of time spent on GPU per execution will still be smaller. Having more instances allows Triton to overlapping different stages of the executions to fully utilize the resources. More detail can be found here
Hi @jhm0104666 ,
Regarding this point:
The MLPerf inference result (v2.0) from NVIDIA shows that a single A100 with Triton, TensorRT gets ~20k resnet50 performance in the "server scenario". Can you give me some hints on how they did this? FYI, I applied many approaches similar to the ones in the MLPerf report (e.g., tensorRT int precision, no pre-process), and achieved ~7k performance.
I notice compute input taking a significant portion of the latency in your 7k performance example:
Client: .... Avg gRPC time: 48261 usec ((un)marshal request/response 545 usec + response wait 47716 usec) Server: Inference count: 111631 Execution count: 1618 Successful request count: 111631 Avg request latency: 35700 usec (overhead 2878 usec + queue 18218 usec + compute input 12250 usec + compute infer 2234 usec + compute output 119 usec)
Inferences/Second vs. Client Average Batch Latency Concurrency: 300, throughput: 6190.94 infer/sec, latency 48288 usec
The use of --shared-memory cuda to your perf_analyzer run as Iman suggested would likely help towards closing the gap. However, I see you mentioned that your client/server are on separate machines which would make the use of CUDA SHM not possible. I would think the 20k numbers by MLPerf are also likely running client/server on the same node to avoid network overhead. You can experiment with this as well to explore the rough perf differences on same node vs separate nodes with other parameters constant.
Similarly the large queue time may be helped by addition of a higher instance count as both Guan and Iman suggested.
hi, I encountered the same problem as @jhm0104666 when using model-analyzer, low gpu utilization.
Question 1: when the final test report shows that the gpu utilization is low (eg: 30%-40%), why does the model-analyzer not continue to automatically increase the model instance number or batch size during the performance test?
Question 2: In addition, I think the extra time overhead (such as server queue time and server compute input time) is still large in some scenarios with high latency requirements and the concurrency test results are not ideal. Can you give some best practices for deploying services using triton server?
thanks.
Q1: There is a known issue with Model Analyzer reporting incorrect GPU usage numbers. It is being actively worked on and hopefully will be addressed soon. Apart from that, you shouldn't target maximum GPU utilization. Your goal should be maximizing throughput or latency. It is possible to maximize GPU utilization while having lower throughput or higher latency numbers.
Q2: Perf Analyzer provides other options such as request-rate-range and custom delivery intervals that might be useful for your profiling scenario.
Hi, I have a somewhat related issue: I'm using the yolov5 repository and I exported models with the provided export.py script, once in ONNX and once in tensorRT .engine file.
what I expect
I would expect to get the timings with the ONNX model using tensorRT execution provider to be around the same than the one using tensorrt backend directly with engine file.
experiment result
 Note that the avg GPU has been reported by just me looking at nvidia-smi during the performance test. The GPU usage in nvidia-smi was very stable.
We can guess that if the ONNX FP16 model was using as much GPU, it probably would have around the same number of inferences / seconds. Though unfortunately it takes half the average GPU usage. Any thought about why ?
perf_analyzer output for TensorRT backend .engine file:
x@x:/home/x/Projects/triton# perf_analyzer -m inference-obj-det-yolo-model -u "localhost:8101" -i gRPC --shared-memory system --output-shared-memory-size=20808000 --concurrency-range 8:8
*** Measurement Settings ***
  Batch size: 1
  Using "time_windows" mode for stabilization
  Measurement window: 5000 msec
  Latency limit: 0 msec
  Concurrency limit: 8 concurrent requests
  Using synchronous calls for inference
  Stabilizing using average latency

Request concurrency: 8
  Client:
    Request count: 4957
    Throughput: 275.337 infer/sec
    Avg latency: 29028 usec (standard deviation 3441 usec)
    p50 latency: 28714 usec
    p90 latency: 29586 usec
    p95 latency: 30113 usec
    p99 latency: 35738 usec
    Avg gRPC time: 29005 usec ((un)marshal request/response 15 usec + response wait 28990 usec)
  Server:
    Inference count: 4958
    Execution count: 4958
    Successful request count: 4958
    Avg request latency: 28393 usec (overhead 118 usec + queue 21257 usec + compute input 2051 usec + compute infer 2168 usec + compute output 2798 usec)

Inferences/Second vs. Client Average Batch Latency
Concurrency: 8, throughput: 275.337 infer/sec, latency 29028 usec
perf_analyzer output for ONNXRUNTIME backend with TensorRT Execution Provider:
x@x:/home/x/Projects/triton# perf_analyzer -m inference-obj-det-yolo-model -u "localhost:8101" -i gRPC --shared-memory system --output-shared-memory-size=20808000 --concurrency-range 8:8
*** Measurement Settings ***
  Batch size: 1
  Using "time_windows" mode for stabilization
  Measurement window: 5000 msec
  Latency limit: 0 msec
  Concurrency limit: 8 concurrent requests
  Using synchronous calls for inference
  Stabilizing using average latency

Request concurrency: 8
  Client:
    Request count: 2625
    Throughput: 145.807 infer/sec
    Avg latency: 54771 usec (standard deviation 1598 usec)
    p50 latency: 54449 usec
    p90 latency: 56060 usec
    p95 latency: 56864 usec
    p99 latency: 60279 usec
    Avg gRPC time: 54748 usec ((un)marshal request/response 15 usec + response wait 54733 usec)
  Server:
    Inference count: 2626
    Execution count: 2626
    Successful request count: 2626
    Avg request latency: 54087 usec (overhead 42 usec + queue 47240 usec + compute input 1157 usec + compute infer 3572 usec + compute output 2075 usec)

Inferences/Second vs. Client Average Batch Latency
Concurrency: 8, throughput: 145.807 infer/sec, latency 54771 usec
Here the main issue I would like to understand is the difference between GPU usage of both this models
For completeness I provide the config.pbtxt: TensorRT backend
name: "inference-obj-det-yolo-model"
platform: "tensorrt_plan"
max_batch_size: 1

input [
  {
    name: "images"
    data_type: TYPE_FP16
    format: FORMAT_NCHW
    dims: [ 3, 768, 1280 ]
  }
]

output [
  {
    name: "output"
    data_type: TYPE_FP16
    dims: [ -1, -1 ]
  }
]

instance_group [
    {
      count: 1
      kind: KIND_GPU
      gpus: [ 0 ]
    }
]
ONNX backend:
name: "inference-obj-det-yolo-model"
platform: "onnxruntime_onnx"
max_batch_size: 0

input [
  {
    name: "images"
    data_type: TYPE_FP16
    dims: [ 1, 3, 768, 1280 ]
  }
]

output [
  {
    name: "output"
    data_type: TYPE_FP16
    dims: [ 1, 61200, 85 ]
  }
]

instance_group [
    {
      count: 1
      kind: KIND_GPU
      gpus: [ 0 ]
    }
]
optimization { execution_accelerators {
  gpu_execution_accelerator : [ {
    name : "tensorrt"
    parameters { key: "precision_mode" value: "FP16" }
    parameters { key: "trt_engine_cache_enable" value: "true" }
    parameters { key: "trt_engine_cache_path" value: "x" }
    parameters { key: "max_workspace_size_bytes" value: "1073741824" }}
  ]
}}
maybe this is worth opening an issue on its own
Closing issue due to inactivity. If you would like this reopened for follow-up, let us know.