[Perf] The performance of conv2d is very very poor if the inChannel and outChannel are small and height and width are large in webgl.
Tested using https://honry.github.io/webnn-samples/style_transfer/?backend=webgl
| Type | Time(ms) | Inputs | Output |
|---|---|---|---|
| Conv2D | 82.86 | input0: 4D[1,548,548,4]input1: 4D[9,9,4,3] | 1,540,540,3 |
| Conv2D | 63.09 | input0: 4D[1,548,548,3]input1: 4D[9,9,3,4] | 1,540,540,4 |
(The tool currently does not work for WebGL https://honry.github.io/webnn-samples/style_transfer/?backend=webgl, Binary was compiled with different shapes than the current args. Shapes 1,8,270,270 and 1,270,270,8 must match, so I manually tested conv2d on WebGL, which has the similar time consumption)
I fixed the filter size and the input channel and only left the height and the width of the input variable.
async function benchmark(heightOrWidth) {
  let round = 100;
  let sum = 0;
  for (let i = 0; i < round; i++) {
    profile = await tf.profile(() => {
      const x = tf.ones([1, heightOrWidth, heightOrWidth, 4]);
      const w = tf.ones([9, 9, 4, 3]);
      return tf.conv2d(x, w, 1, 'same');
    });
    sum += profile.kernels[0].kernelTimeMs;
  }
  return sum / round;
}
benchmark 1
If I record the time of conv2d directly for each heightOrWidth:
times = []
for (let heightOrWidth = 30; heightOrWidth <= 600; heightOrWidth+=30) {
  times.push(await benchmark(heightOrWidth));
}
times = await Promise.all(times);
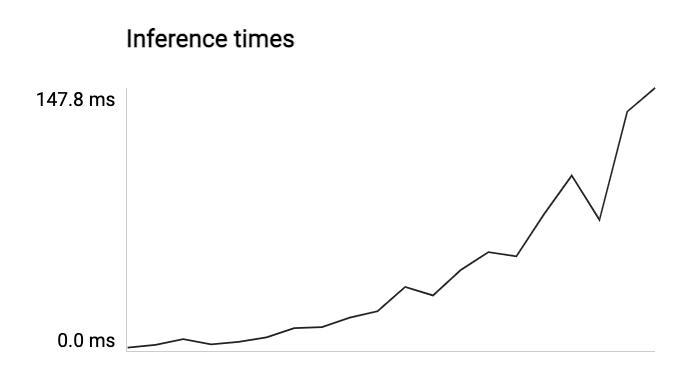
then I got an array of [1.4743816, 2.9944416000000005, 6.279137600000001, 3.293609599999999, 4.7277888, 7.1990096, 12.439380800000002, 13.0924192, 18.3757648, 21.993214399999996, 35.686953599999995, 30.904654400000013, 45.27920160000001, 55.33339359999997, 52.895646400000004, 76.7184272, 98.52946560000002, 73.52736640000002, 134.48132640000006, 147.821496]
(if heightOrWidth===600, it takes 147.821496ms)
benchmark 2
If we ignore WebGL's parallelism, the complexity of conv2d is O(heightOrWidth^2) (assume batchSize, inChannel, outChannel, filterSize are constants).
Then I compute a new array, divide the time by heightOrWidth^2
timesX = times.map((v, i) => {
  const heightOrWidth = (i + 1) * 30;
  return v / (heightOrWidth * heightOrWidth);
});
Then I got an array of [0.0016382017777777779, 0.0008317893333333335, 0.0007752021728395063, 0.00022872288888888882, 0.00021012394666666665, 0.00022219165432098767, 0.000282072126984127, 0.00022729894444444444, 0.00025206810425240054, 0.00024436904888888885, 0.0003277038898071625, 0.00023846183950617294, 0.00029769363313609474, 0.0003136813696145123, 0.00026121306864197534, 0.0003329792847222222, 0.0003788137854671281, 0.000252151462277092, 0.0004139160554016622, 0.00041061526666666664]
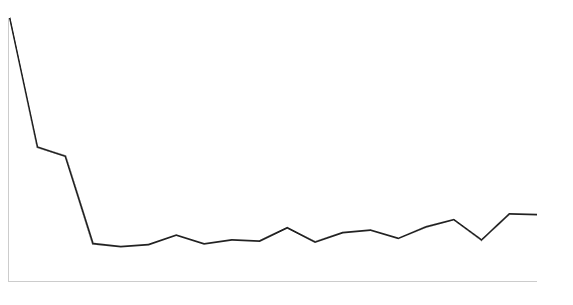
The trend line is close to a horizontal line, which proves the complexity of conv2d is O(heightOrWidth^2).
In conclusion, from my perspective, this high performance makes sense because the time is supposed to increase quadratically with the heightOrWidth (batch size, channels, etc.). @pyu10055 @qjia7 Do you have any other concerns?
@Linchenn Great investigation. Your conclusion makes sense for me. I think one possible way is to explore another efficient algorithm to process such kind of shape. But it's not easy to do.
Do you have examples/hints for other algorithms? @qjia7
As we known, WebGL's conv2d has three ways (1*1, img2col and brute force). Do you mean a new way to compute such shape?
Do you have examples/hints for other algorithms? @qjia7
As we known, WebGL's
conv2dhas three ways (1*1, img2col and brute force). Do you mean a new way to compute such shape?
Yes, I mean a new way. Sorry I don't have good suggestion how to do it. We are also exploring some new methods for some shapes in webgpu. This conv2d's filter width and height are relatively larger compared with 3x3, which means more data are repeated access. So I am wondering how much time are spent on im2col and how much time are spent on matmul. And for lots of repeated access, we usually use shared memory in webgpu. But in webgl, there is no shared memory. Maybe fuse im2col+matmul in one shader can slightly help it.
Great catch! Let me check if I could benchmark im2col and matmul separately first. Thank you!
Just tested the performance of conv2dWithIm2Row's two shaders for the above inputs (codes at https://github.com/tensorflow/tfjs/pull/6476):
    average time for Img2col: 4.018999999761581,
    average time for MatMul: 0.7599999985098839,
    average percent for Img2col: 0.8681931448007002,
    average percent for MatMul: 0.11660471469266888.
Found the Im2ColPackedProgram shader takes the majority time, 87% percentage time of conv2dWithIm2Row.
The texture shape affect this, since the performance is different for different texture allocate appraoch:
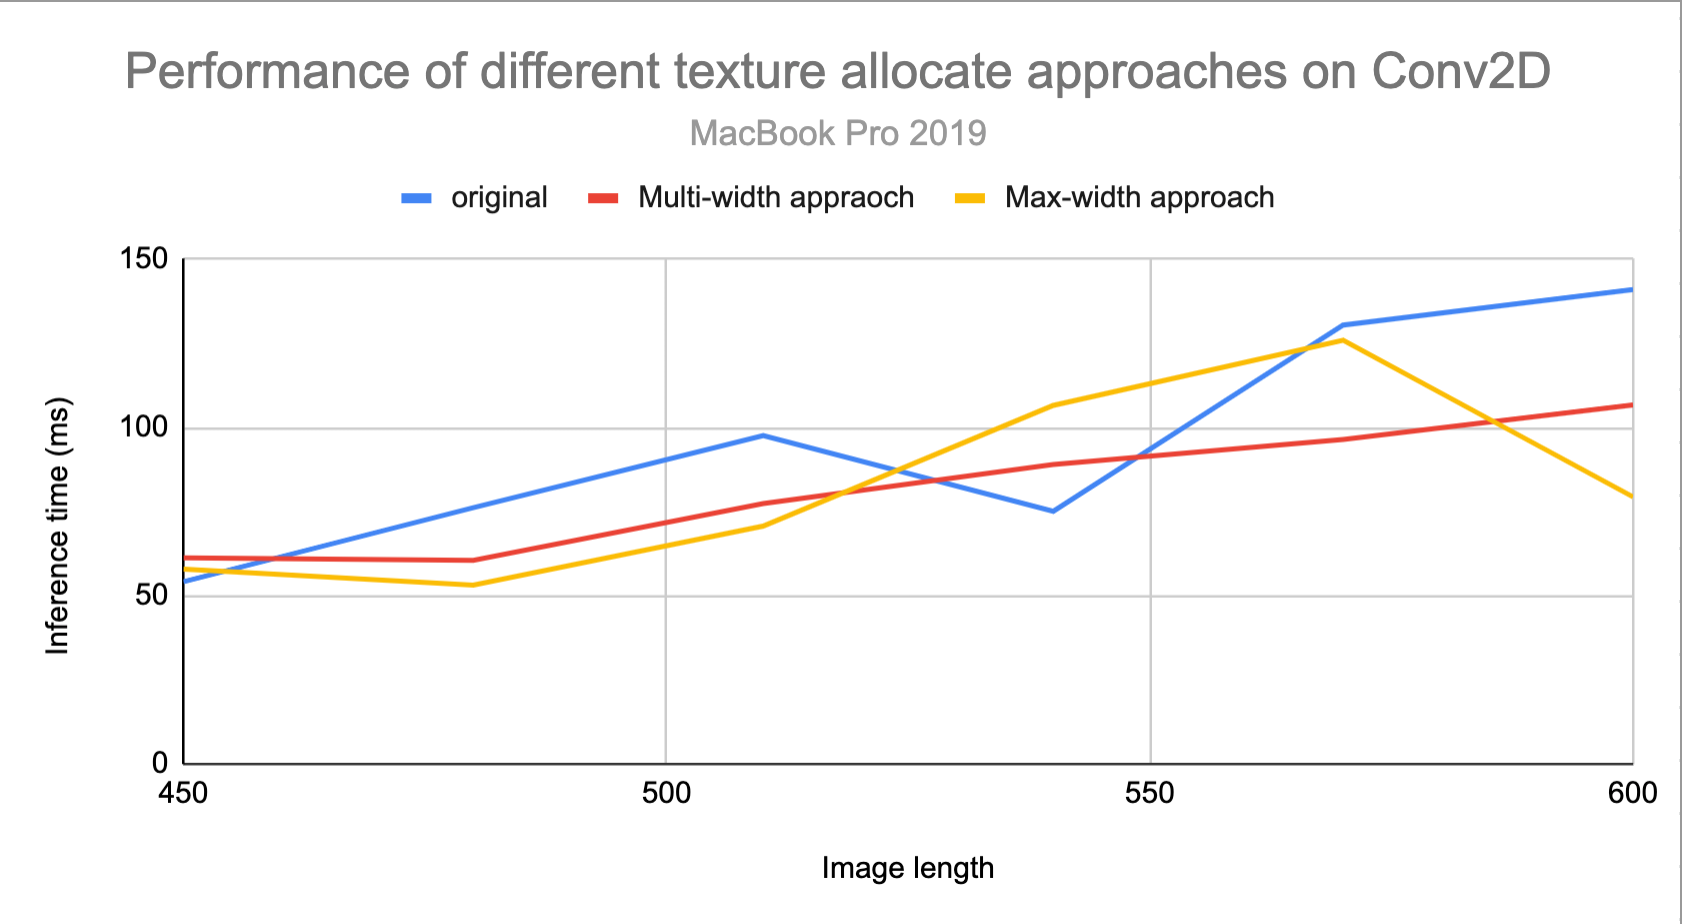
For Conv2D (input0: 4D[1,548,548,4]input1: 4D[9,9,4,3]), the inference time originally is 113.71579360000004ms, Multi-width approach's time is 85.30354879999999ms, while Max-width approach's time is 92.5761184ms.
The benchmark function should exclude the inference time of the first run:
async function benchmark(heightOrWidth) {
  let round = 50;
  let sum = 0;

  const x = tf.ones([1, heightOrWidth, heightOrWidth, 4]);
  const w = tf.ones([9, 9, 4, 3]);
  // Warm up run
  tf.conv2d(x, w, 1, 'same');

  for (let i = 0; i < round; i++) {
    profile = await tf.profile(() => {
      return tf.conv2d(x, w, 1, 'same');
    });
    sum += profile.kernels[0].kernelTimeMs;
  }
  return sum / round;
}
Hi, @qjia7
Thank you for opening this issue. Since this issue has been open for a long time, the code/debug information for this issue may not be relevant with the current state of the code base.
The TFJs team is constantly improving the framework by fixing bugs and adding new features. We suggest you try the latest TFJs version with the latest compatible hardware configuration which could potentially resolve the issue. If you are still facing the issue, please create a new GitHub issue with your latest findings, with all the debugging information which could help us investigate.
Please follow the release notes to stay up to date with the latest developments which are happening in the Tensorflow.js space.
Thank you for your support and cooperation.
This issue has been marked stale because it has no recent activity since 7 days. It will be closed if no further activity occurs. Thank you.
This issue was closed due to lack of activity after being marked stale for past 7 days.