profiler

profiler copied to clipboard
Weird step-time graph (discontinuous graph)
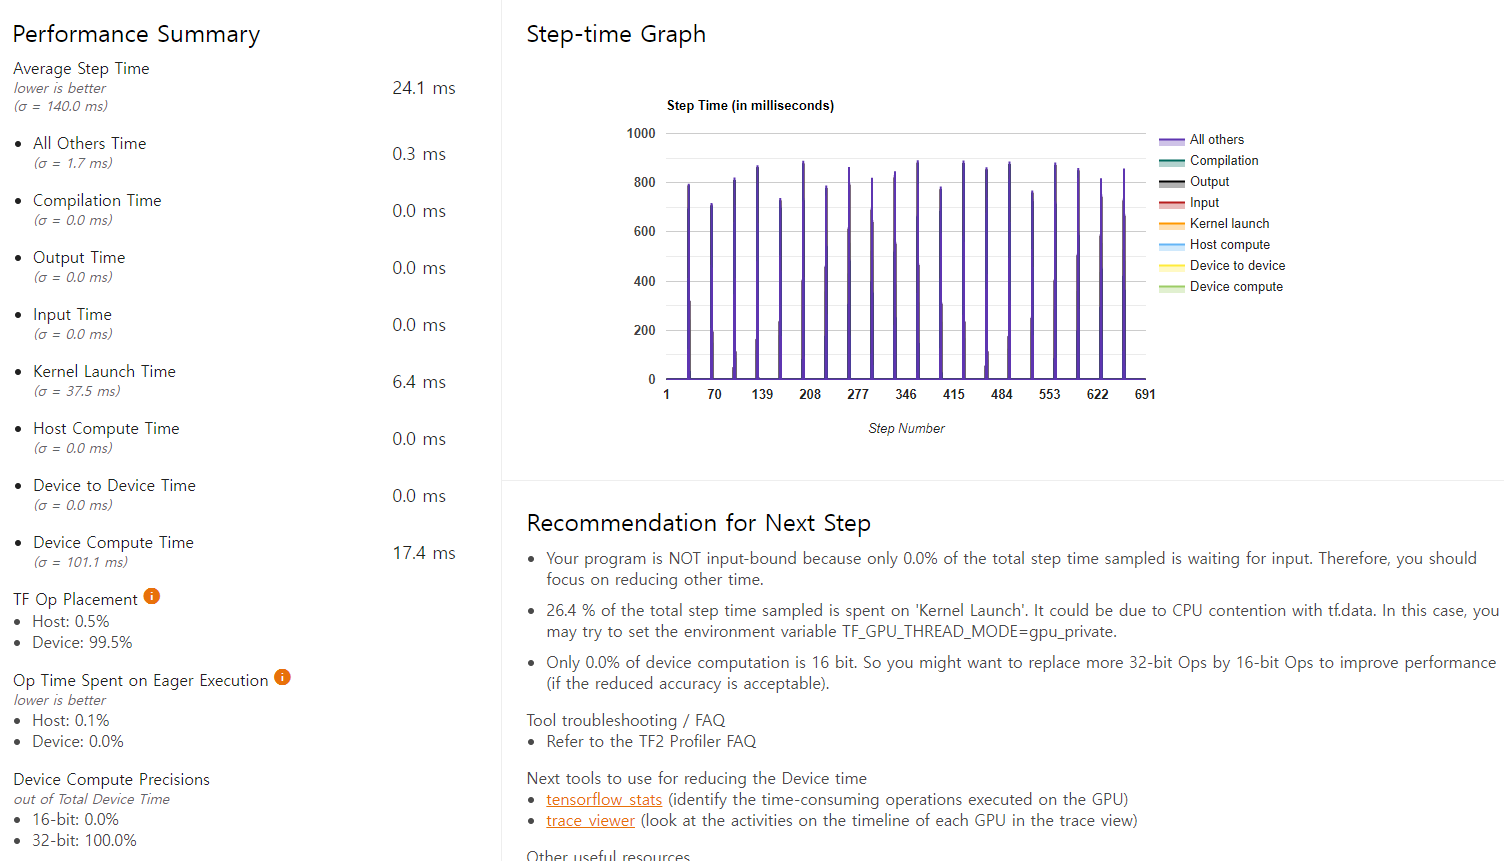 I got some weird step-time graph which is not continuous when I executed this code: https://keras.io/examples/audio/ctc_asr/
It shows high kernel launch overheads, but the step-time graph bar is represented intermittently. In trace viewer, there are lots of "Stream (Compute,Memcpy)" and "Stream (Memset,Compute)"
Could you please let me know what the problem is?