Gene expression and signaling role seems reversed
Hello!
Thank you for your excellent tool. I am using CellChat to study EMT in my system and I noticed an odd discrepancy.
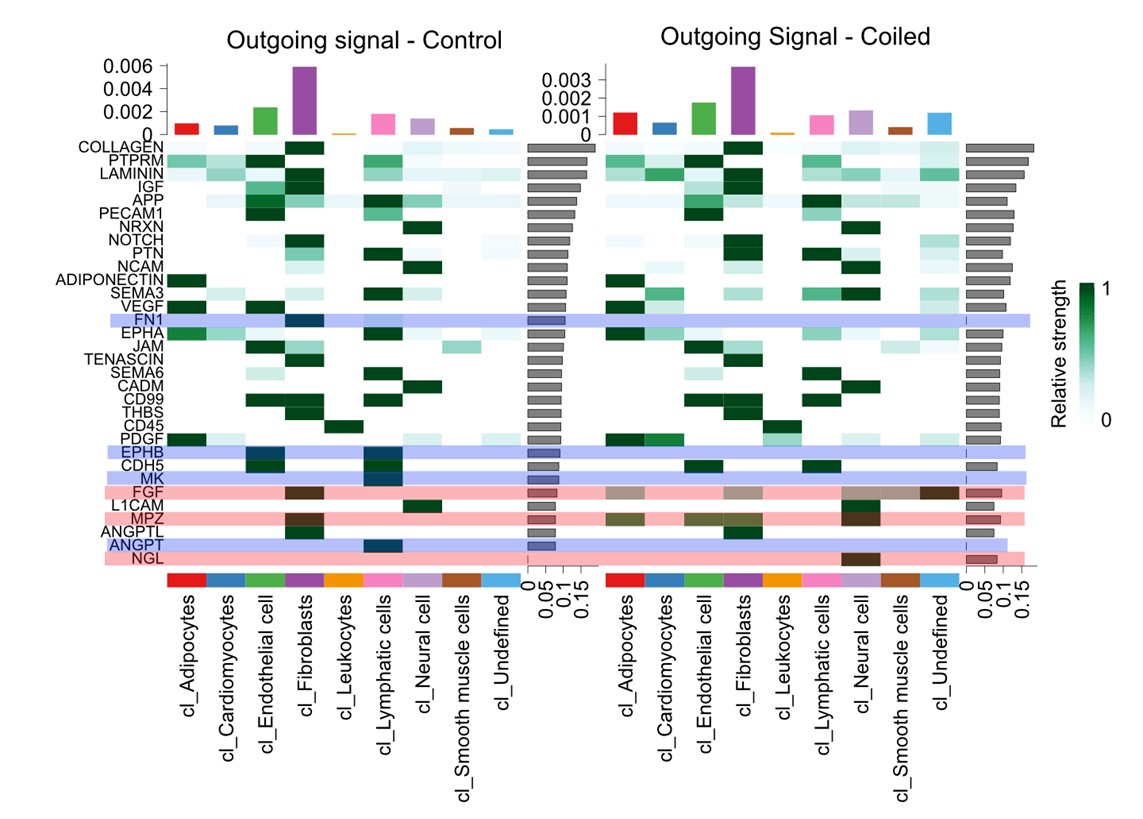
I saw that the FN1 signalling pathway was present in the control, but not the case in the outgoing signature heatmap. With a strong outgoing signature coming from fibroblasts.
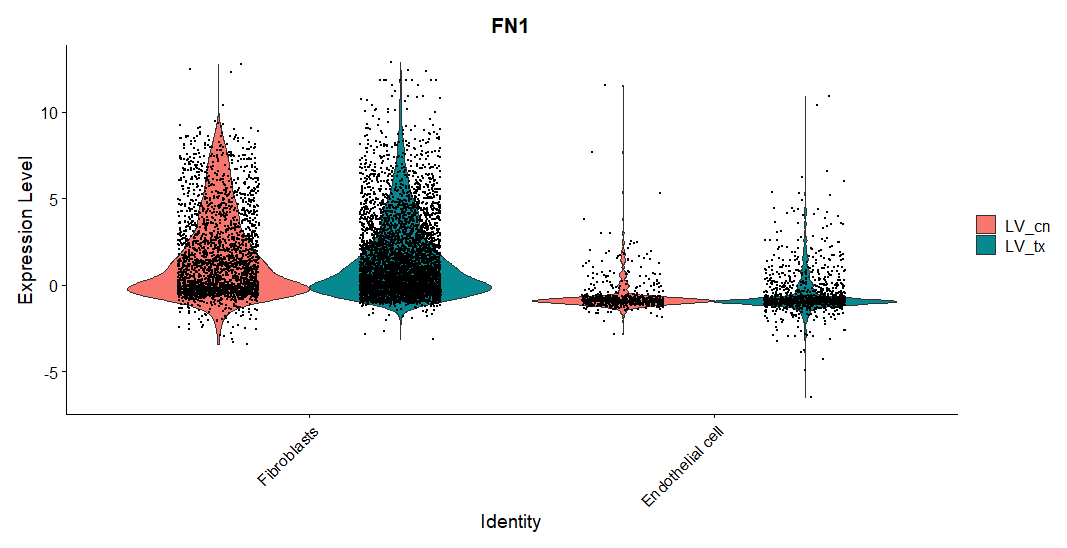
This being said, when I look at the FN1 gene, it seems like it is significantly higher expressed in case than control (log2FC = 0.8, FDR = 1e-5), The FN receptors ("ITGA3","ITGA4","ITGA5","ITGA8","ITGAV","ITGA4","ITGA2B","CD44","SDC1","SDC4", "ITGB1", "ITGB7",
"ITGB3","ITGB6"), do not seem to be DE
While I am aware that cell communication is not reliant on DE, I am having a hard time reconciling these differences. With this min mind, could you please provide an explanation as to how this can happen? If I see this pattern should I assume FN1 is a false positive?
Thanks again, Dustin
@DustinSokolowski Sorry for the late. (1) You can further visualize the inferred network using circle plot; (2) You can examine the gene expression using the function computeAveExpr. Please check details in the tutorial. (3) When you plot the gene expression in violin plot using Seurat, you should use the normalized data without negative values. In your case, you may need to set the DefaultAssay.
Hey!
Thank you very much for your advice. I'll run these analyses ASAP and get back to you if anything strange is still going on.
Best, Dustin