High memory usage when using 'many tiny objects'
As before, this isn't a bug report really, but place to show my observations.
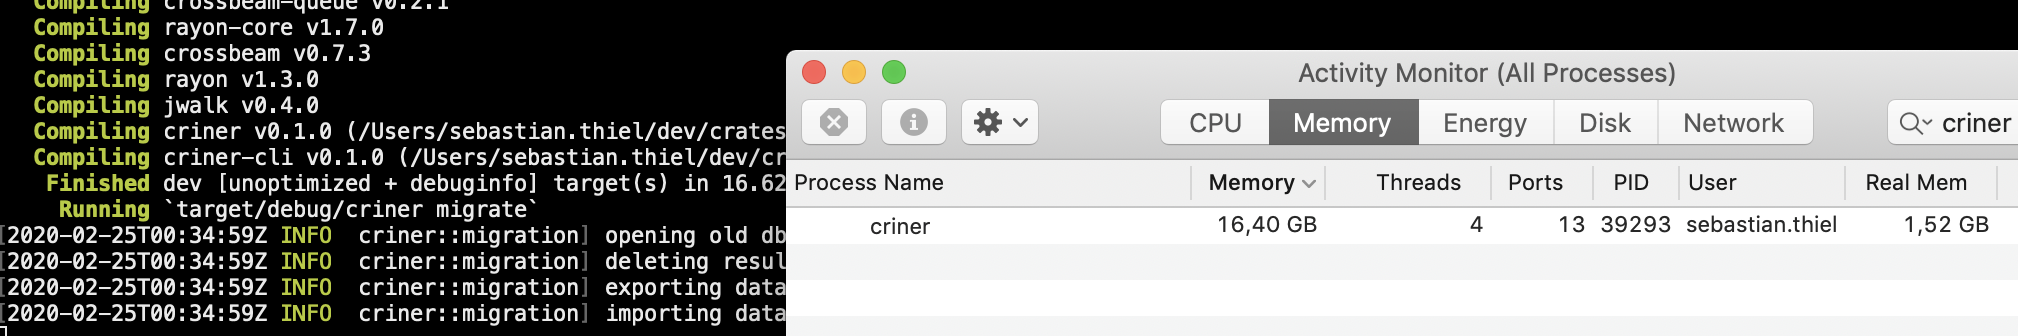
For context: Criner is now generating one html file per crate version as part of reporting, of which there are around 210k. It does so with 25 concurrent tasks. As the report generator runs continuously, it should only generate files when it didn't do so already, but do generate if the generator version changed.
Observations
Initially, I was keeping this information as symbolic link (as these are small) in the file tree, which was moderately fast. Then I thought, why not use sled and store a marker which really is nothing more than an enum with two unit variants (even though only one is used right now).
Unsurprisingly, it was ridiculously fast, but shortly after the first phase (download and processing)…
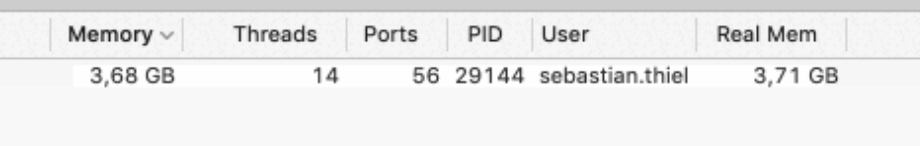
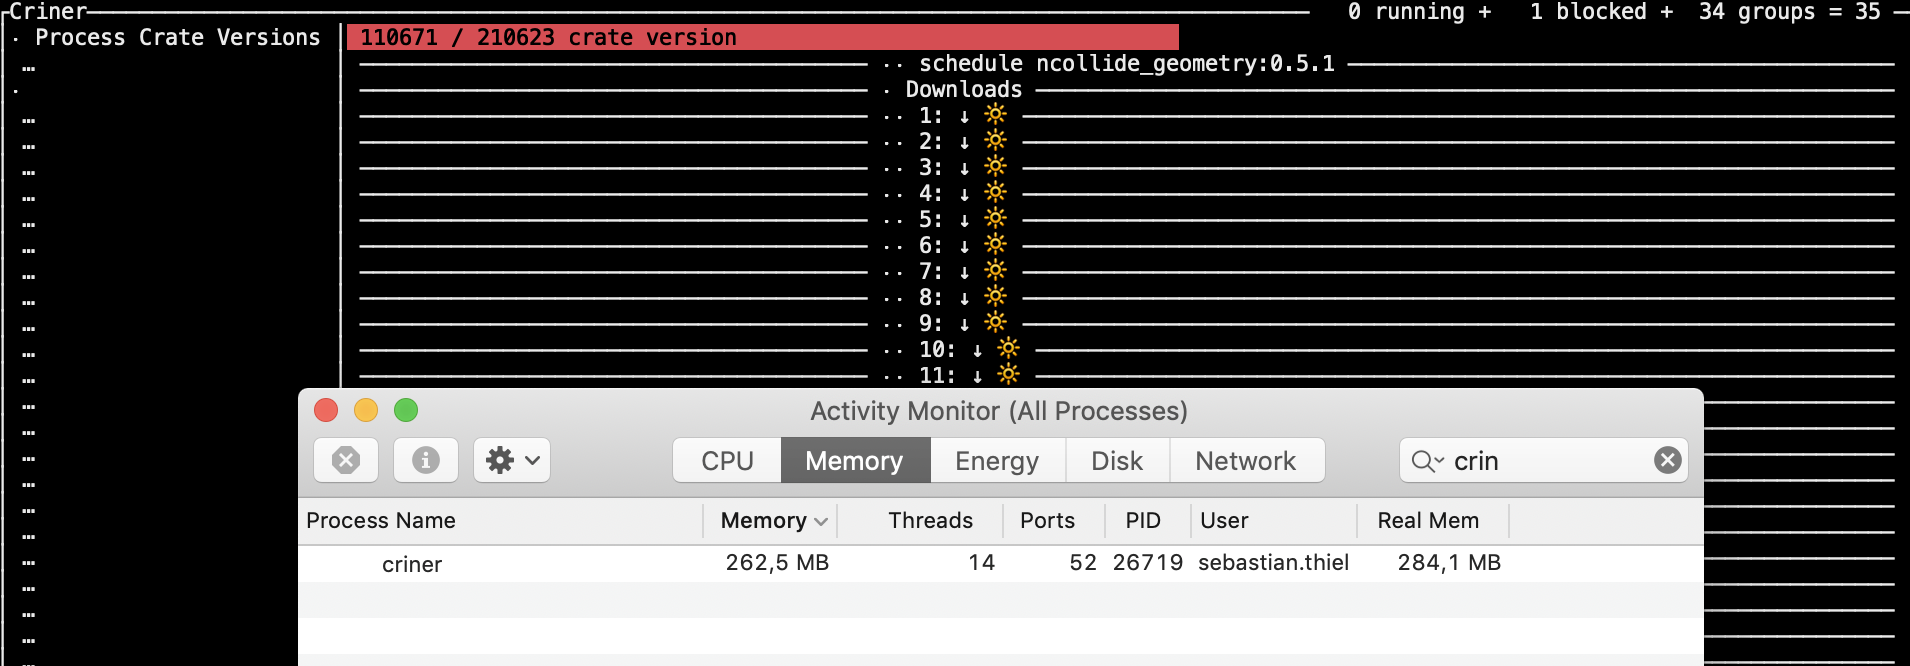 …with an average memory consumption of 280MB, it entered the last phase, report generation This means to get each of these tiny objects in relatively random access (without a moderately long key
This wasn't the case before, and the report right now does nothing but create a hello world file, but that doesn't even happen as it realizes that the work is already done.
Hopes
As this should eventually run on hardware with 512MB of memory, I would hope there will be away to avoid consuming 'real' memory, as this is scarce and it's unlikely that this machine will be able/allowed to swap. Maybe it's possible to implement a memory cap, sacrificing performance for using less memory.
Details
- sled version **git+https://github.com/spacejam/sled#eecbbda8e2b5859a769c0eb43a154f7ee220edc3
- rustc version
- 1.41
- operating system
- MacOS 10.14
Database content

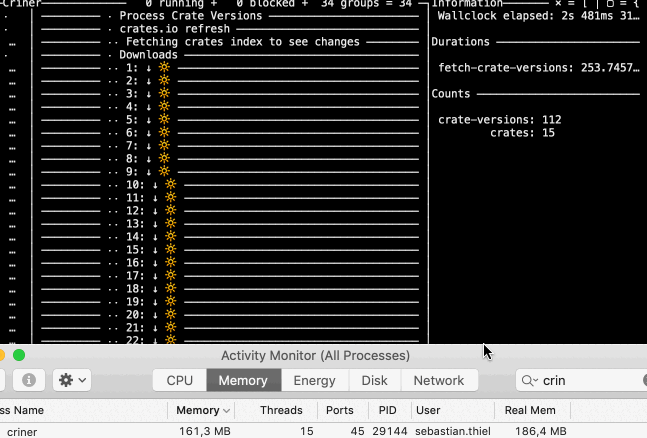
And something you might find interesting: now that I have undone that change to use symlinks as marker, it became evident that sled now is way faster when iterating crate versions for processing. It seems that a large memory footprint is slowing it down.
Please let me know if you need a commit to reproduce it - assuming you let the program run for a night to download 33GB of crates, from there it will easily reproduce this behaviour.
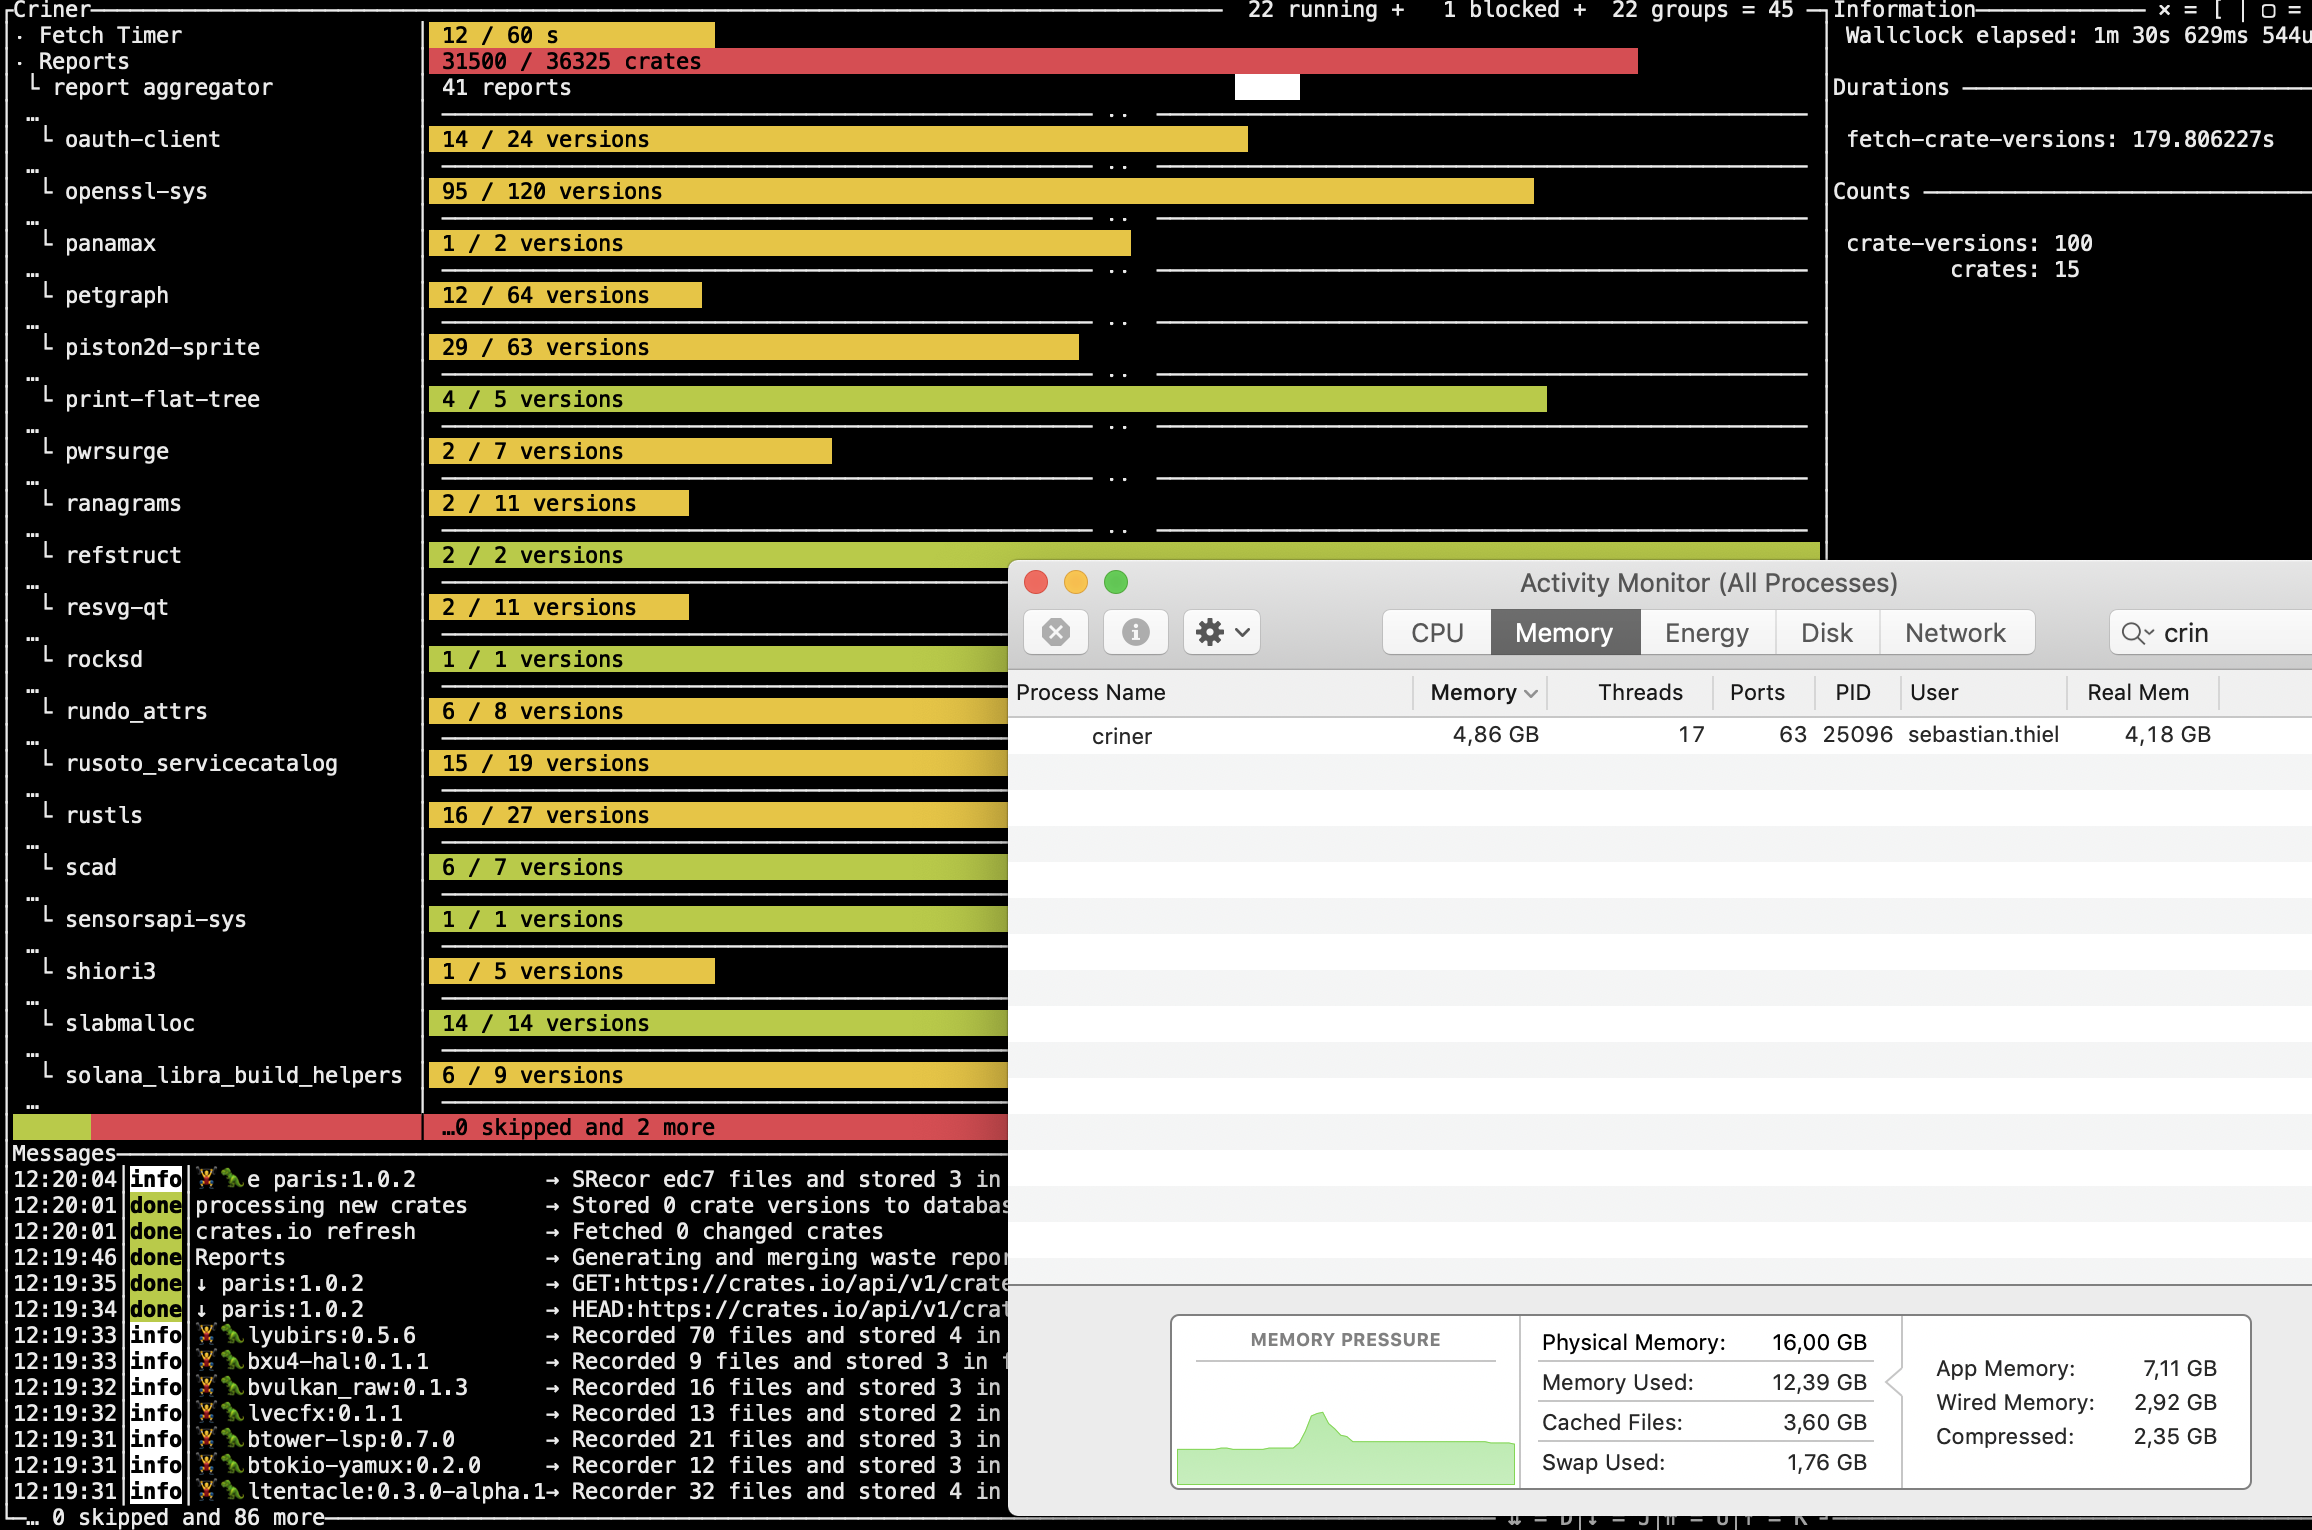
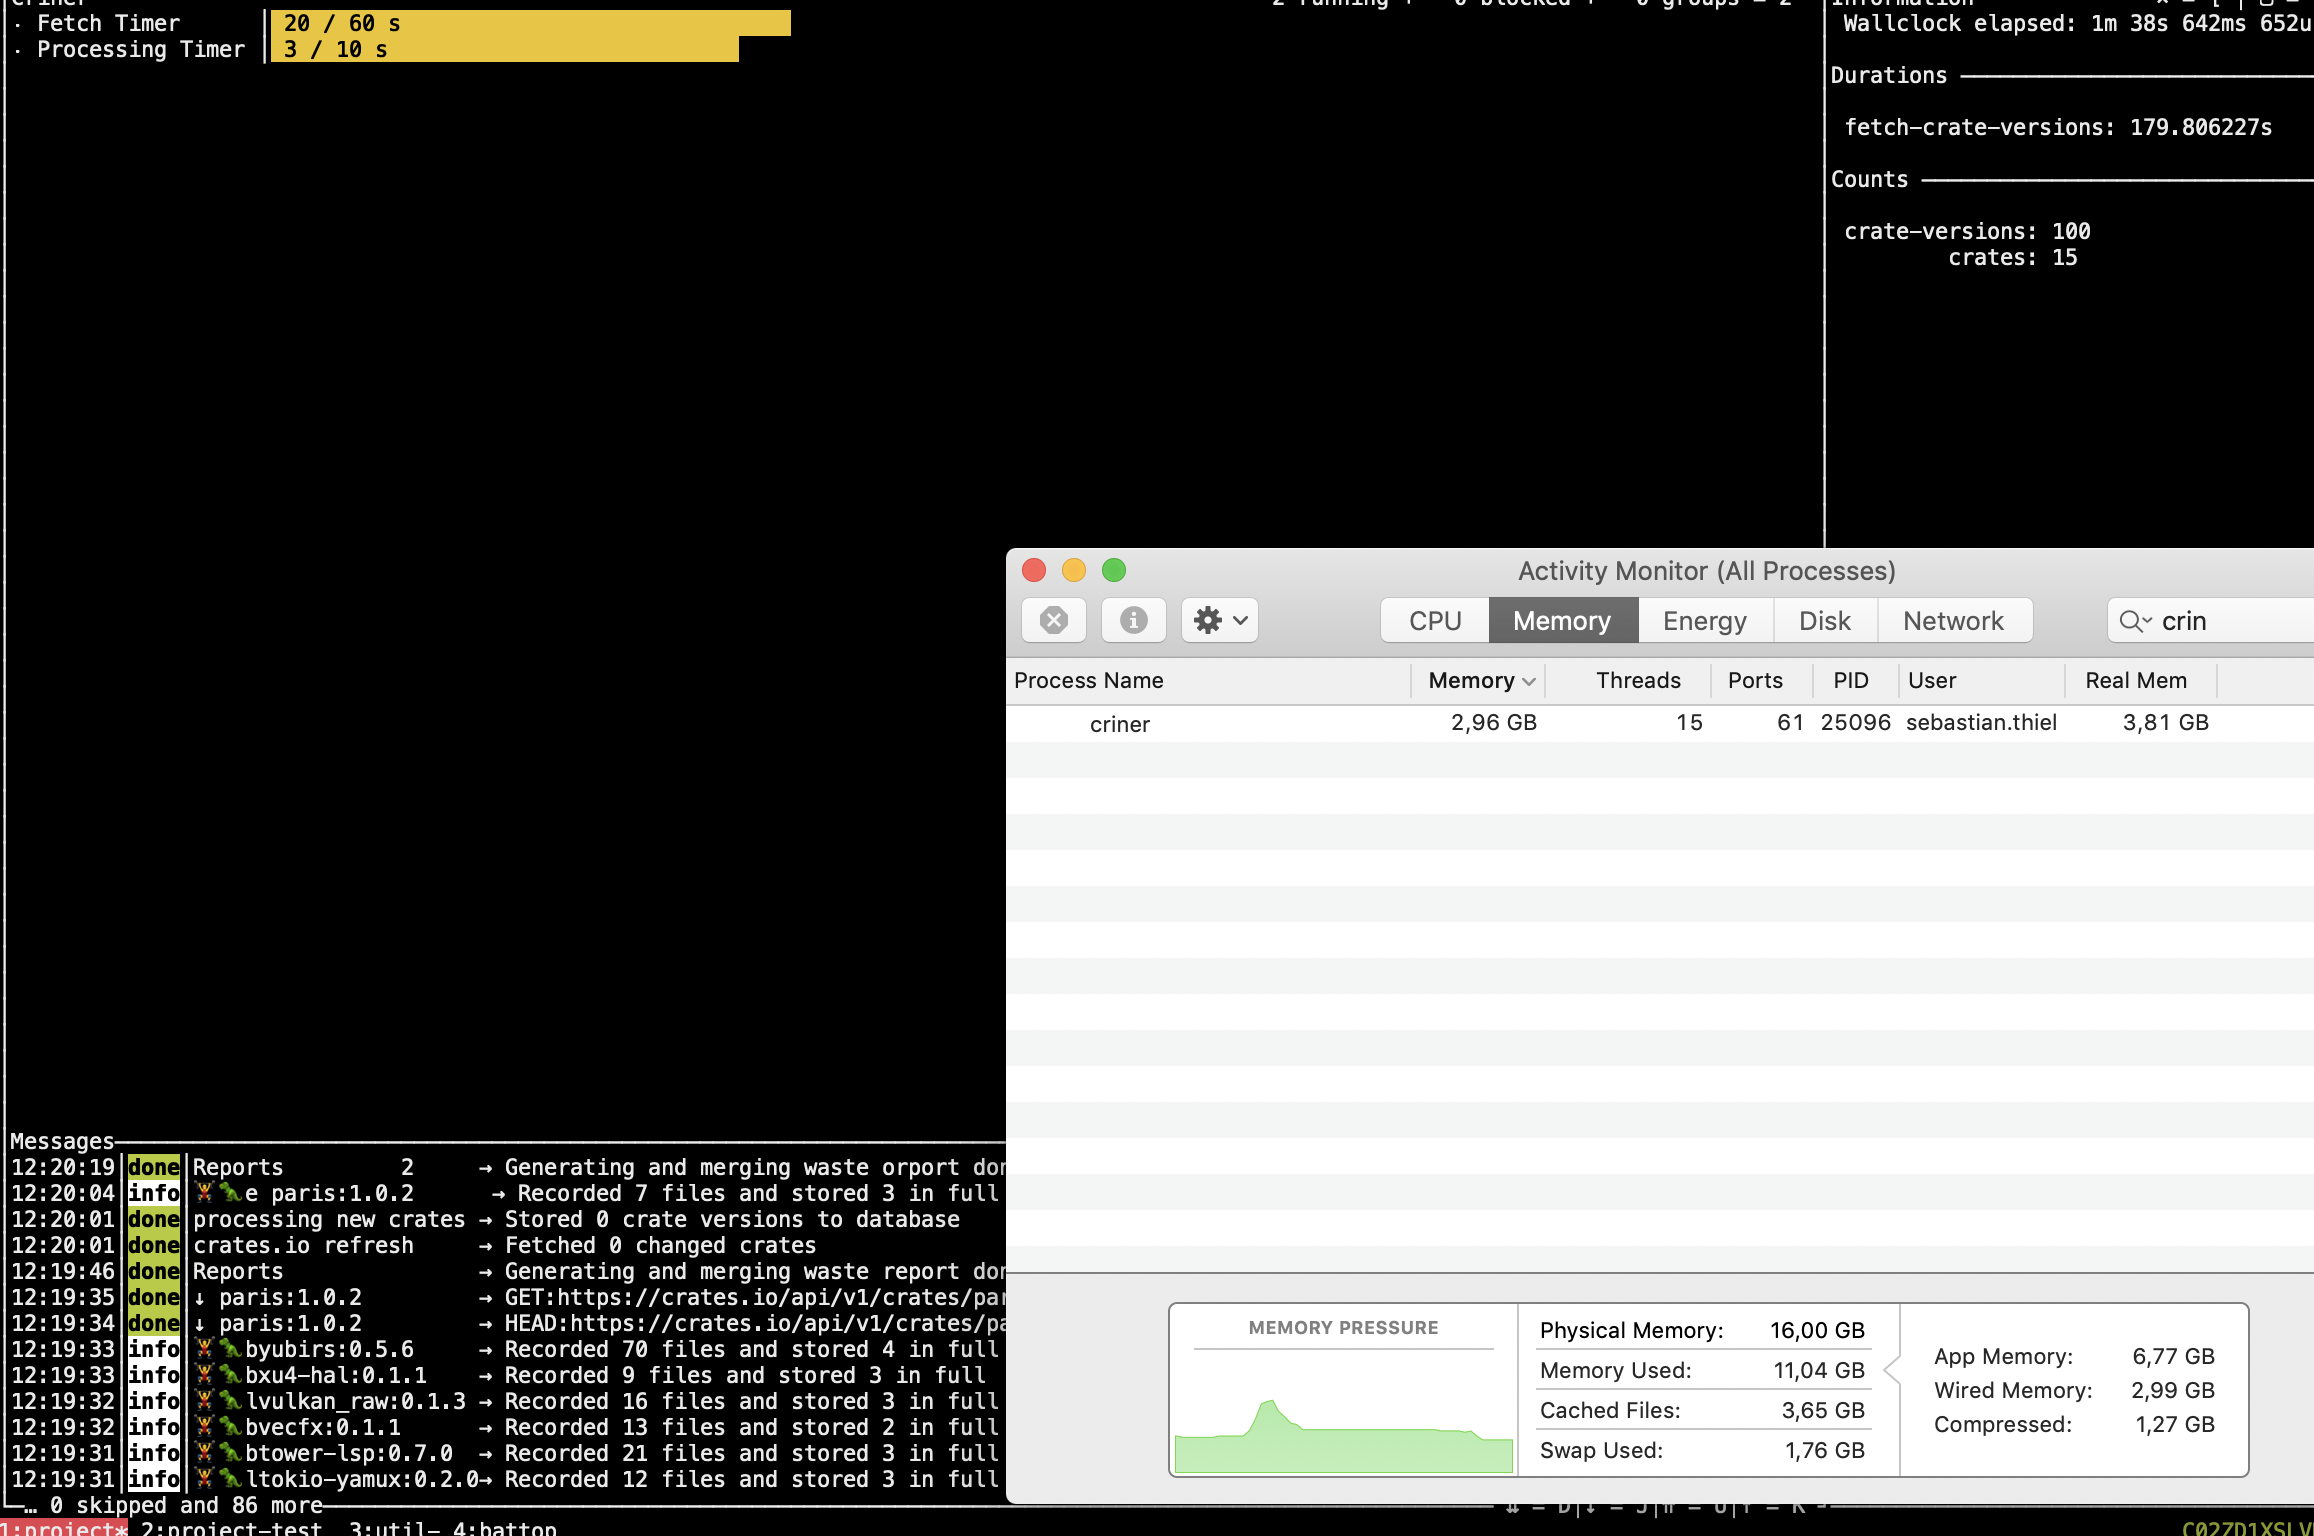
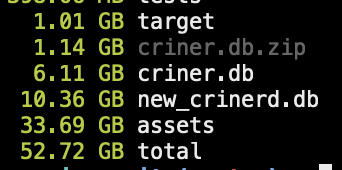
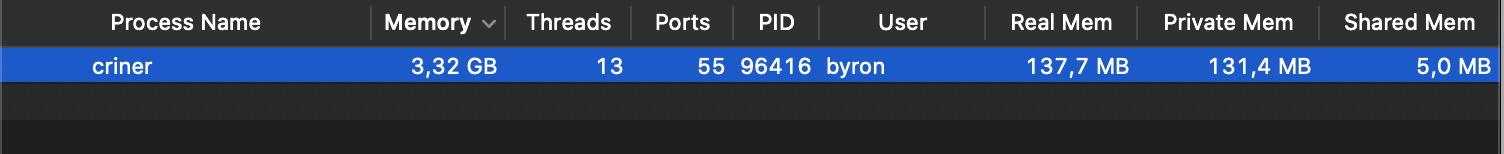
In the same vein, when trying to re-export the data after deleting the tree with the small objects, it consumed huge amounts of memory…
 …which slowly rose. The CPU wasn't particularly busy, apparently this was a CPU bound operation. Edit: I think that is because the system is swapping a lot.
The result was unexpected, too, as I ended up with a bigger version of the same data:
…which slowly rose. The CPU wasn't particularly busy, apparently this was a CPU bound operation. Edit: I think that is because the system is swapping a lot.
The result was unexpected, too, as I ended up with a bigger version of the same data:
 The new database is 40% larger, even though I would have hoped to release memory.
I will try again and also upgrade to the latest version on master.
The new database is 40% larger, even though I would have hoped to release memory.
I will try again and also upgrade to the latest version on master.
pub fn migrate(db_path: impl AsRef<Path>) -> crate::error::Result<()> {
    log::info!("opening old db");
    let old_db = old_sled::open(db_path.as_ref()).unwrap();
    let new_db = sled::open("./new_crinerd.db").unwrap();
    log::info!("exporting data");
    let data = old_db.export();
    log::info!("importing data");
    new_db.import(data);
    Ok(())
}
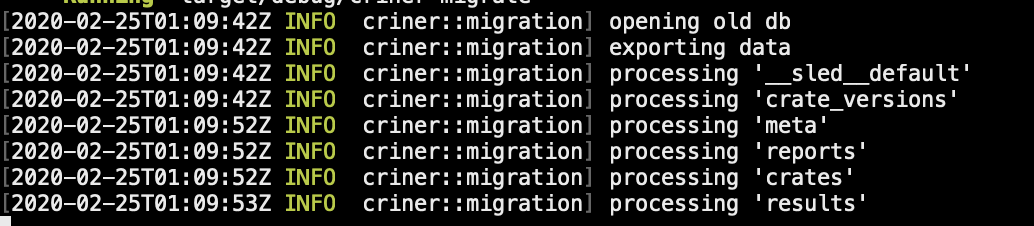
I thought maybe something is wrong with the export/import, so I wrote a 'manual' version. It produced exactly the same result and exhibited the similar memory consumption.
pub fn migrate(db_path: impl AsRef<Path>) -> crate::error::Result<()> {
    log::info!("opening old db");
    let old_db = old_sled::open(db_path.as_ref()).unwrap();
    let new_db = sled::open("./new_crinerd.db").unwrap();
    log::info!("exporting data");
    for tree_name in old_db.tree_names() {
        log::info!("processing '{}'", std::str::from_utf8(tree_name.as_ref()).unwrap());
        let tree = old_db.open_tree(tree_name.as_ref()).unwrap();
        let new_tree = new_db.open_tree(tree_name).unwrap();
        for (k, v) in tree.iter().filter_map(|v| v.ok()) {
            new_tree.insert(k.as_ref(), v.as_ref())?;
        }
    }
    Ok(())
}
Actually it showed that the previously dropped tree, "reports" wasn't actually dropped.
When trying to just skip the trees that shouldn't be tranferred, there was no change in size either…
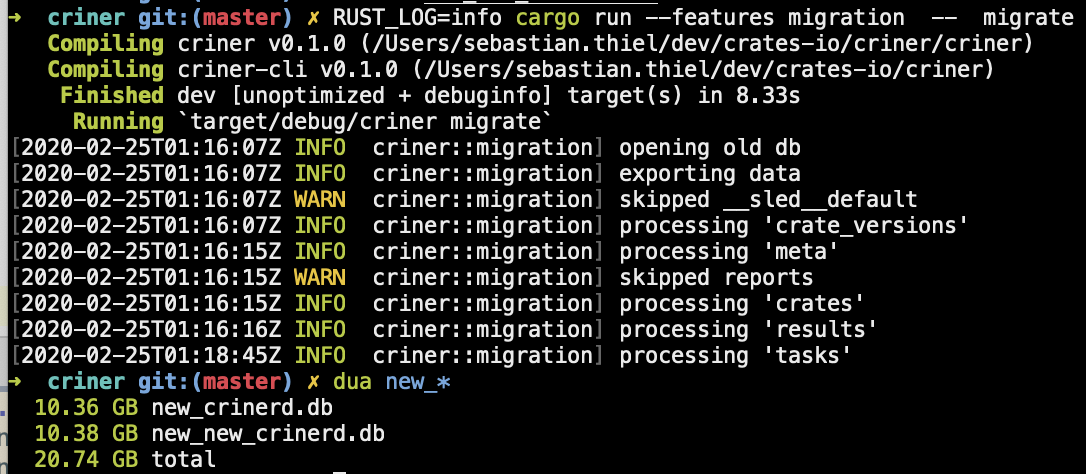 …and it appears that the new version I am using af097b1ef4737a0c5ee56a1f72d2a27a88b70db5 has increased the database size :/.
Important: Here is the database I use for all of the above: https://www.dropbox.com/s/fmka504t8ykner1/criner.db.zip?dl=0
It's just 1.1GB compressed, and should help tremendously when debugging. Here is the sled version that can definitely read it:
old_sled = { version = "0.31.0", package = "sled", rev = "eecbbda8e2b5859a769c0eb43a154f7ee220edc3", git = "https://github.com/spacejam/sled"}
To witness he memory explosion, something like Db::open("db").open_tree("results).len() should be enough. Iterating these small objects is all it takes.
I noticed that it doesn't seem to matter that much how big the objects are, its seems more about the amount of objects. Whether big or small, when one iterates 220k of them this shows up similarly in memory.
@Byron thank you so much for this super detailed report! I really appreciate you shedding light on some of the behavior of this workload, and for providing the necessary info for reproducing it :)
I am happy to help :)! Also I rely on Sled as there seems to be no other option but SQLite, or none I can see, and thus far Sled is a bliss to work with and I want it to succeed!
What do you think are the chances that this will run sustainably on Raspberry Pies with 512MB of RAM? Do you think it's feasible at all to allow trading off speed with memory, or to handle low-memory situations automatically? Thanks for letting me pick your brain a little.
@Byron one thing that isn't clear to me is if it's actually virtual memory or RSS. Could you run massif on your workload and post the analysis it generates via ms_print? That would give me the most actionable info in the least amount of time.
valgrind --tool=massif target/release/crinerd
<feel free to just ctrl + c it after a while>
ms_print massif.out.<PID> > output
The master branch uses a pretty large amount of virtual memory intentionally.
Also, looking closer at your report info, sled does have a cache size limit, but just know that it's a small proportion of the actual memory used currently. If you set the cache_size configurable, to something smaller, it should keep things much more contained.
Thanks so much for your tips! I will be switching to the latest commit in #995 moving forward.
I also took a closer look at the cache_capacity configurable, and think that might be useful. When digging deeper, however, I discovered that it is already smart in detecting usable settings for the machine it is running on - it's fair to use memory when it's available, while allowing it to be lowered. This is such a relief because I felt like Sled pushes the memory-for-performance slider to the limits without regard for memory consumption, which wasn't entirely correct. It's still the question on how it's possible to see memory consumption like I do with a default cache capacity set like cache_capacity: 1024 * 1024 * 1024, // 1gb.
Something else that struck me is virtual memory - which in the version I am using now seems to be as high as usual, but the real memory is much more moderate! For a moment I thought I got it all wrong from the start, but that doesn't seem to be right either when looking at the Gifs above that clear show the real memory going as high as the 'memory', which seems to include virtual memory.
Today it looks like this though.
 Something I don't understand is how 'virtual' memory is even possible without mmap. Could you give a hint?
Regarding the request of running criner in valgrind, I will happily do that but can't promise it to be happening before March - my 'big' computer died yesterday and now I am on a 'small' one which will find docker very punishing.
cache_capacity is currently a bit messed up as it uses the on-disk size of things instead of the larger in-memory representation. So, 1gb is not actually the default memory usage, it's the amount of disk space that items loaded in memory will take, which will result in a lot more space in memory being used, at least for smaller keys and values. So, play around with setting it to a much smaller value.
Virtual memory just means that the OS has given the process some chunk of logical space that it may use. This is usually from your memory allocator calling mmap (which doesn't need to be pinned to a file or anything, it can be an anonymous (non-file-backed) map). Maybe some allocators still call sbrk but I don't know. Anyway, that memory only exists as a logical allocation. It's not until your cpu tries to access that memory that a page fault happens and some real space is lazily mapped to the logical space your process was "given". Older versions of Go would always show up as using 1TB of ram, but that was just virtual memory. Master branch was using a ton of virtual memory, not paged-in resident memory. I don't know if your tool actually means Resident Set Size when it says Real Memory, that's not a term I know. But RSS is not very high even with the larger PageTable patches that I just reverted on the master branch, so I don't really know what the deal is with that screenshot.
I'm sorry to hear about your computer issue, I hope it doesn't cause too much friction for you!
Thanks for your reply and your sympathy regarding the computer issue - now I am working on a 5 year old MBPro with a proper keyboard, and enjoying it tremendously :).
Despite valuing your help and input tremendously, I had to make the hard decision to switch to another database to have better control over space consumption and memory usage. It was quite some work and it wasn't without its pains, so I wrote about the entire experience hoping that others, including Sled, can benefit.
https://github.com/crates-io/criner/issues/1
I will keep checking on Sleds progress and hope that other projects of mine can use it some time in the future.
Please feel free to close this issue if it's not substantial enough for being fixed directly.
I'm currently looking into this approach for dealing with this: https://github.com/spacejam/sled/issues/1093