Visualization/Dev Tools
I thought I'd write this up since it's one of many things I'd like to do here and like most tertiary things I have no experience with. I was looking into options for Dev Tools for Solid and I realized that it doesn't particularly make sense to have the same sort of tools as React as the Components are ephemeral. Visualizing a virtual tree as rendered in the DOM is not as valuable as visualizing the data. So I was thinking how to visual Solid's Reactive Graph and what it would look like. Solid actually has 2 graphs sitting on top of each other. The dependency graph and the structural graph.
-
The dependency graph is the one we are more accustomed to. The one that we've in MobX articles or visualizations for reactive programming. CycleJS and RxJS have done a good job of showing the visuals for data streams. This is more recognizing how change propagates. So if you change one Signal, the computations that track it also re-evaluate, and the ones that track those (if it's a memo) also track it. The characteristic in Solid though that might make this different is generally this graph is pretty shallow since we avoid unnecessary reactive wrappers. And it isn't so much a single graph but clusters or groupings of signals across different computations. This visual would be really useful when tracking fine details but it would be difficult perhaps to see your app from this view.
-
The structural graph is more like the graph one might find in Redux dev tools. It is more of a tree where there is a Root, and each child Computation holds each of its children all the way down. When I say children I don't mean things it depends on but rather computations that were created in executing it's context. Ie.. things that would be destroyed if ever re-evaluated (other than sub-roots). What we could see here are those child computations, any registered cleanup methods.
So the trick here is putting the two together I think. If we walk the structural graph we could at any point traverse into the dependency graph to see that computations dependencies. It would be interesting to see how writing a certain signal can trigger computations that change the shape of the structural graph. But you'd almost need to link back to lines in the JavaScript source for computation re-evaluation to have much value here. It would be interesting if we could use this as a way of highlighting the currently executing reactive scope and to set breakpoints, and from there using Source maps to take us back into our Component code.
Unfortunately I don't believe anyone has done anything like this before. Or atleast I haven't come across it. But it would be a really sweet addition to libraries like this. Not only for debugging and performance optimization, but for visualization for learning. Anyway thought I'd throw this out there.
Thinking about it, even if the representation is a little inaccurate, I think it would still be helpful to have a React-dev-tools like tree of components (as opposed to literal DOM tree) so you can see props and state. I know the hold up for a lot of juniors ive worked with in any library is "did the state actually change" so to be able to f12 and see yes when I click the toggle button and see the value in a child component has changed without setting up a set of loggers is really valuable
@HIMISOCOOL For sure. One of the reasons I've been trying to work this out, and haven't jumped on to existing tools is it would also take some doing. Solid's state doesn't belong to its components. There is no tie, no lifecycle. It probably could be done by patching createComponent and all signal creators. And then I guess they'd still be nameless. I suppose we could list them by type/value. Like:
Signal | "John" Signal | true Memo | "John Smith"
The awkward part is the JSX view is made up Effects and Memo's too. But maybe this is still an easier place to start.
Although I imagine a lot of the same things would be needed in either case. Component or reactive scope, we'd need to be tracking signal creation and a way to bind them to a debugger tree to show updates. And first and foremost this would require a debug build so that there is no overhead in production. I haven't had much of a chance to look into this further, but I think that is the starting point.
I know this has limited use outside this one example, but since it's related to the issue @HIMISOCOOL mentioned of ppl not being able to "see" changes in state, I'll throw it out here just in case.
In the reactivity docs you have this one example of an useReducer pattern which you can hook up to Redux Dev Tools pretty easily, adding some lines:
// deep reconciled immutable reducer
const useReducer = (reducer, init) => {
  const [state, setState] = createState(init),
    [getAction, dispatch] = createSignal();

  const devTools =
      window.__REDUX_DEVTOOLS_EXTENSION__ &&
      window.__REDUX_DEVTOOLS_EXTENSION__.connect();
  devTools.init(init)

  createDependentEffect(
    (prevState = init) => {
      const action = getAction()
      if (!action) return prevState;
      const next = reducer(prevState, action);
      devTools.send(action, next);
      setState(reconcile(next));
      return next;
    },
    [getAction]
  );
  return [state, dispatch];
};
Clearly hackish, maybe useful.
@k-onrad I had played with it before a little but not in the last couple years. I'd love to try that again I think there are some simple options there for people's global stores. Not sure if there are any gotcha's but I'd love to see that working. There probably is a general way to connect a single Solid State object to Redux Dev Tools.
The redux stuff plays really nice with that pattern because everything passes through the DependentEffect and all that, but I was playing with the idea of middleware (logger, error reporters, etc) at the state/signal level, which would be more flexible and also more aligned with what seems to me to be Solid's way of dealing with change (atomically).
Eventually came up with a kind of monkeypatching, after reading Redux's docs on middleware. Something like this:
const applyMiddleware = ([state, setState]) => (...middlewares) => {
  // Give each middleware access to state
  // Then modify setter
  middlewares
  .map(m => m(state))
  .forEach(middleware => {
    setState = middleware(setState)
  })

  return [state, setState]
}
Then a logger that would be triggered on every change could be something like:
const logger = (state) => (setter) => {
  console.log("INITIAL STATE:", state[$RAW]);

  // Wrap the setter, give a new one back
  const setState = (...args) => {
    setter(...args);
    console.log("NEW STATE:", state[$RAW]);
  };

  return setState;
};
Then this would give you back the same API but every setState would trigger a log.
const [state, setState] = applyMiddleware(createState({ count: 0 }))(logger)
Obviously logging could be done in a simpler way, and probably createDependentEffect could deal with similar things, but only after the change was made to state.
I guess the advantage of this approach is that it is pretty general and has access to state both before and after any changes were made.
There is a decent chance that I'm overlooking a Solid-er way of doing this, and if so please do point it out, I've only just begun understanding the framework.
I've introduced a new Dev Mode. This gives us tools to serialize the reactive ownership graph. We technically could already serialize the dependency graph. I also added the ability to hook into every reactive render regardless of what updates. Open to figuring out what is needed to make this work better but we at least in theory have the means to make dev tools.
This is sort of PoC of these hooks and what sort of thing could be done: https://codesandbox.io/s/testing-solid-dev-mode-h1j2g
Does that allow to get the dependency graph at runtime? I missed that in S, wanted to try building some dev tools then. Stepping through the ticks and displaying all current triggers/ dependencies / changes wouldn't be that hard probably.
@ranmacar I'd love if someone could help me look into it. I was working on serialization of ownership graph but dependencies are possible too as they are on the same object.. You can always get the current owner or listener in a context so doing so at the root and walking through it can output it. In dev mode I give each node a unique ID that could be used for visualization. I don't quite know the best way to build this. It might just take some tweaking to find the best way.. I made a rudementary serializer but you could walk the structure yourself and construct something.
If you have ideas I'm more than happy to discuss. This is like 4-5th on my priority list and I feel like it keeps getting pushed back.
For anybody that is following this issue and not on the discord, @ckissane and I developed an idea here, with a demo here
is something like this useful? https://github.com/whyboris/TypeScript-Call-Graph
You can probably visualize the dependency graph as a network of nodes, like with vis-network then make it so that users can inspect each node and show the value of that node (for instance, if it is a signal, they can inspect the state of the signal). Similarly, I've done this before on a toy lib I've made. Components is a little bit tricky.
Screenshot of the demo @modderme123 and I developed:
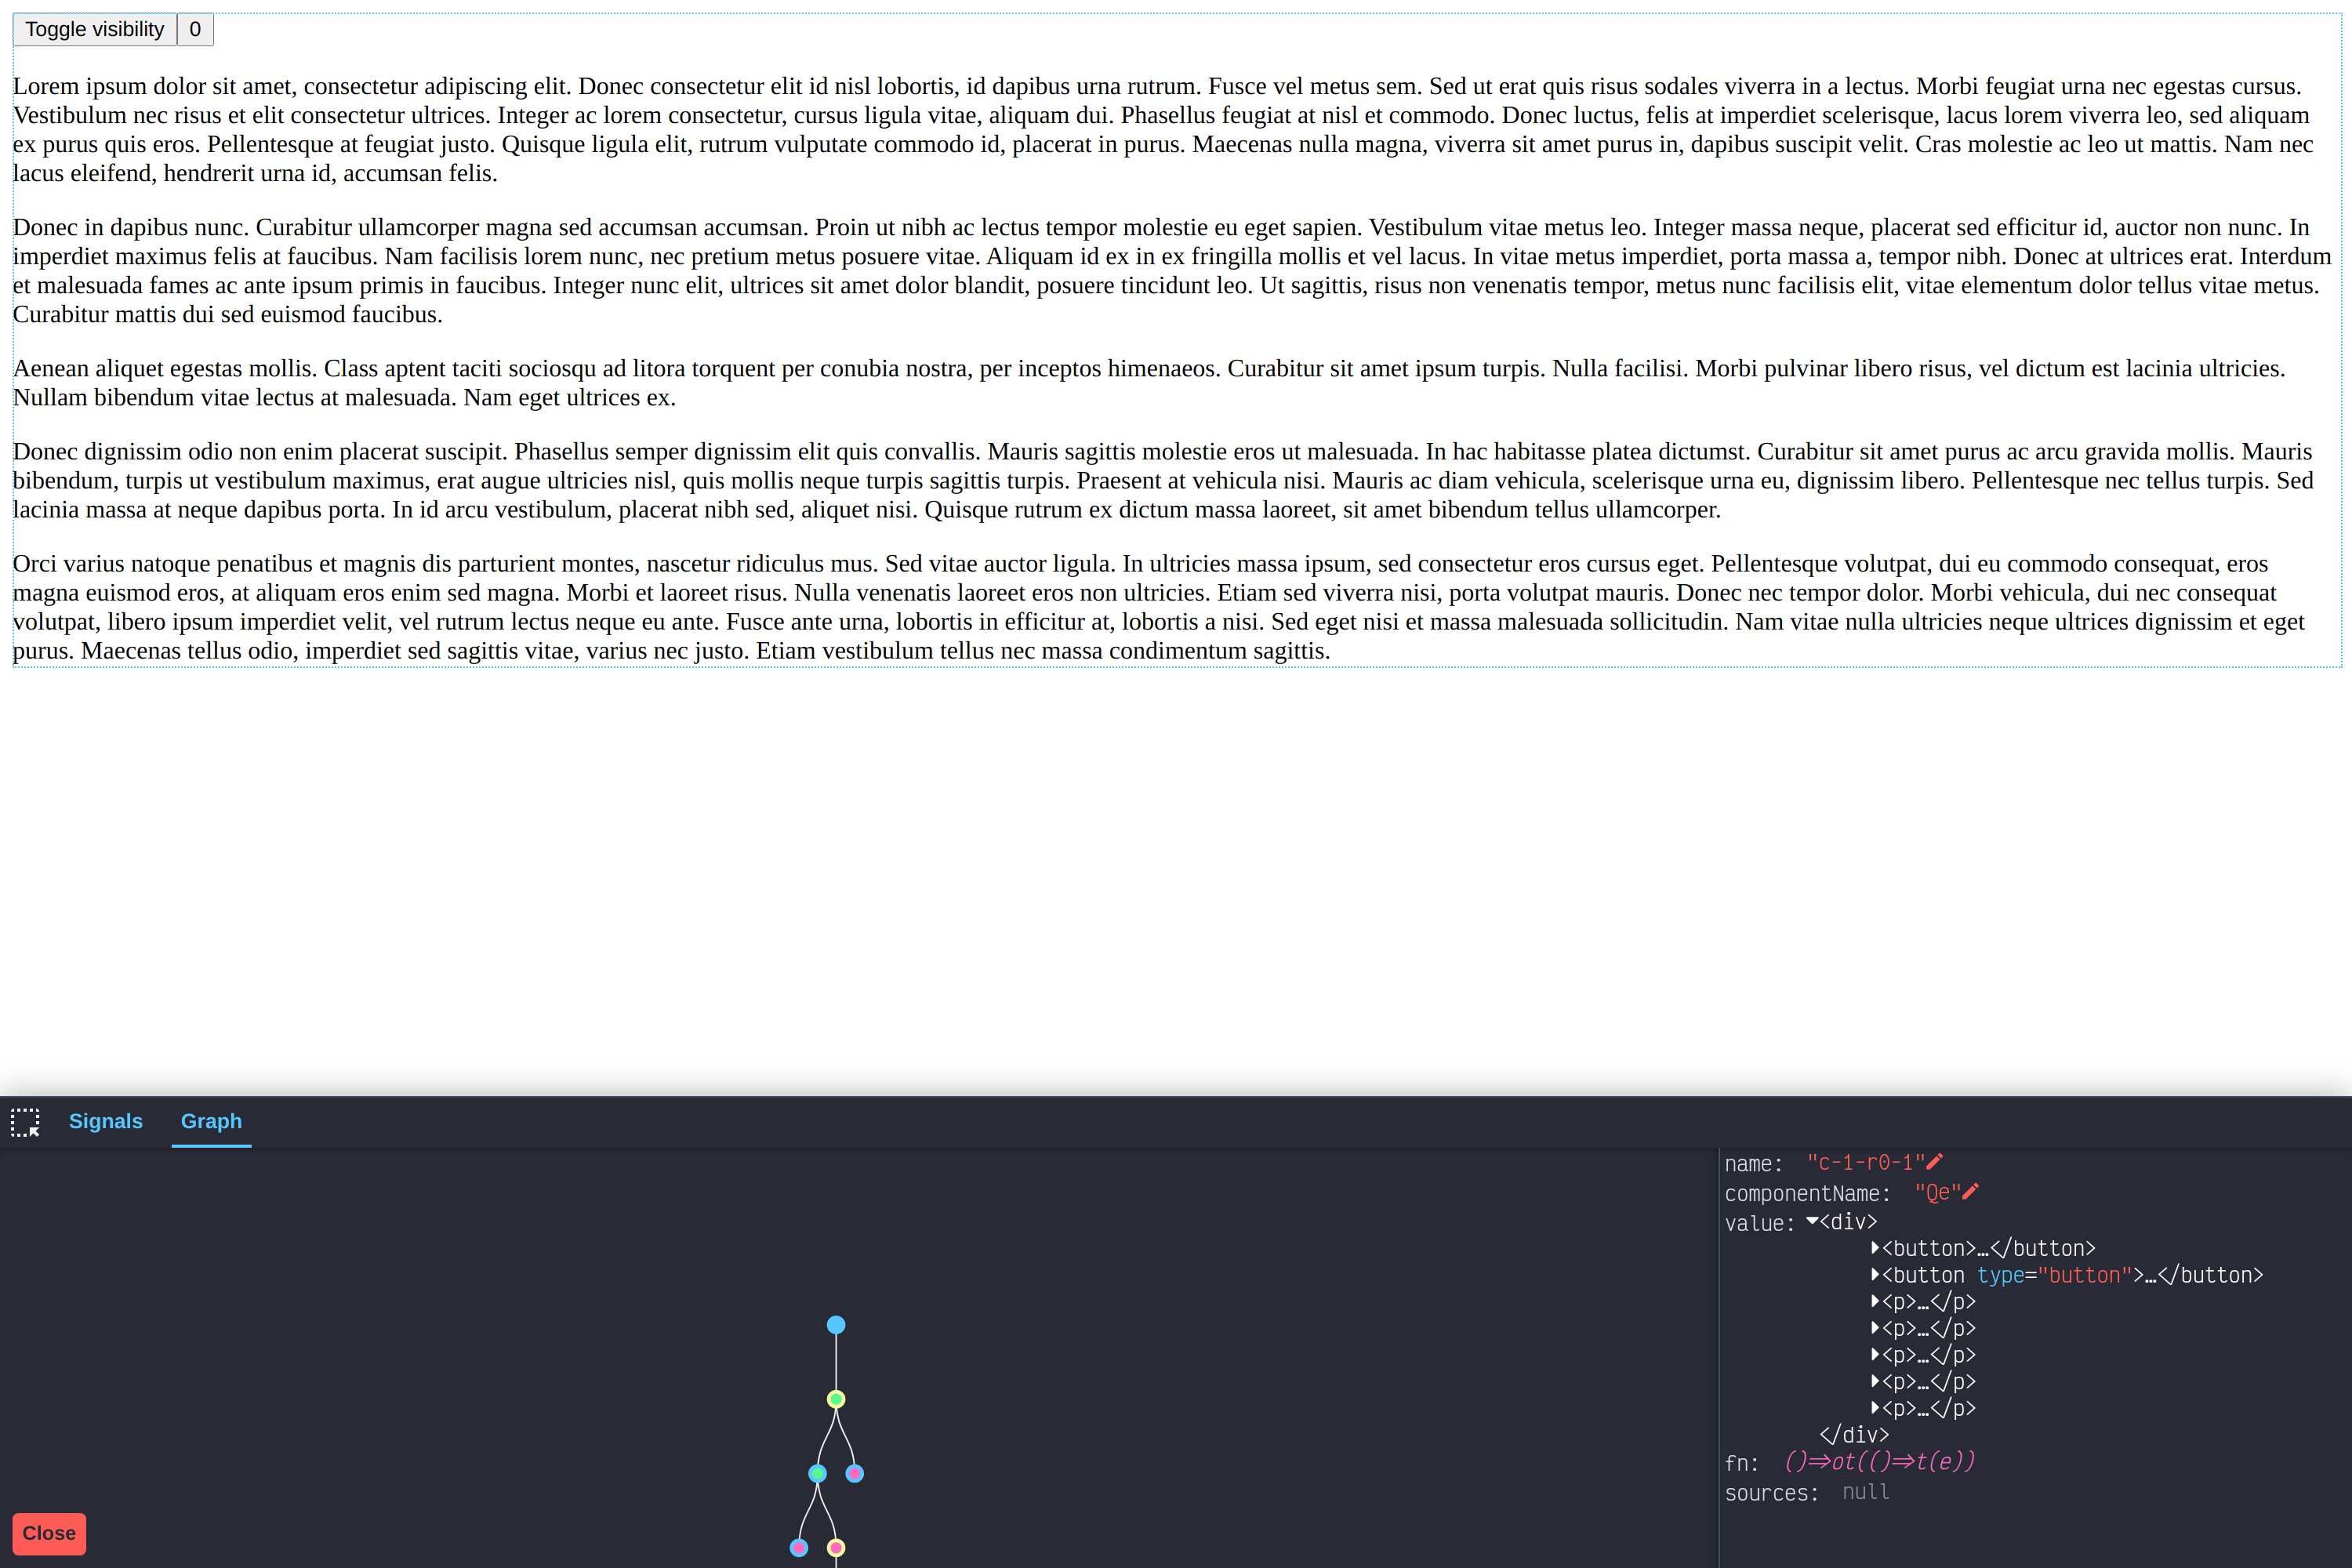 (https://solid-debugger-demo.netlify.app/)
(repo: https://github.com/cm-tech/solid-debugger)
(https://solid-debugger-demo.netlify.app/)
(repo: https://github.com/cm-tech/solid-debugger)
I wonder if it would be useful to overlay the (signal) dependency graph islands on top of the component tree - yes the component tree doesn't really exist at runtime (because of the idea of vanishing components), but doing this could help to quickly get an idea of how things are tied together across an application.
I wonder if it would be useful to overlay the (signal) dependency graph islands on top of the component tree - yes the component tree doesn't really exist at runtime (because of the idea of vanishing components), but doing this could help to quickly get an idea of how things are tied together across an application.
I think having some way to quickly jump from a component to its dependency graph would be a valuable thing for users. It just fits the mental model they have when authoring in solidjs. Could be as easy as an icon right next to the component name in the tree view.
@ckissane I really like the prototype you have there! I think it's definitely the right direction to take 👍
Vitest is gonna using this https://graph-controller.yeger.eu/
If it would be useful, i could bring it to the solid side.
I wonder if it would be useful to overlay the (signal) dependency graph islands on top of the component tree - yes the component tree doesn't really exist at runtime (because of the idea of vanishing components), but doing this could help to quickly get an idea of how things are tied together across an application.
I think having some way to quickly jump from a component to its dependency graph would be a valuable thing for users. It just fits the mental model they have when authoring in solidjs. Could be as easy as an icon right next to the component name in the tree view.
@ckissane I really like the prototype you have there! I think it's definitely the right direction to take 👍
Thanks!
I haven't updated this issue in a while but we've had a lot of progress thanks to @thetarnav, funded by the Solid Fellowship project. There is still work to be done but I'm happy to announce we've been added to chrome store: https://chrome.google.com/webstore/detail/solid-devtools/kmcfjchnmmaeeagadbhoofajiopoceel
The repo is here: https://github.com/thetarnav/solid-devtools
There is still a lot to do there. But I think I'm happy to close the blanket issue and continue the work there to take things where we need to update this to a solid-community project.