LCP in Summary not matching LCP in DevTools
Have you read the documentation?
- [X] Yes, I've read the how to make a reproducable bug guide
- [X] Yes, I've read the how to debug my script guide
URL
https://www.emirates.com/ae/english/experience/
What are you trying to accomplish
I am running a test by passing in a header to append to the user-agent. This is the text " PTST", which is what webpagetest add to their tests (we're trying to mirror the tests we run between sitespeed.io and WPT).
However what I can see from the sitespeed.io report is the LCP is always less than the FCP, which is definitely incorrect. When I run the test with the " PTST" I can see the LCP is correctly longer than the FCP.
For the run that is reporting a lower LCP, I took the timeline from the run and loaded it into Chrome Dev Tools and the LCP is 1 ms longer than FCP, so I think sitespeed.io is potentially misreporting the value.
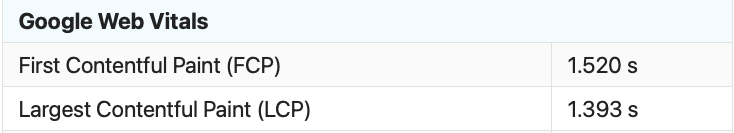
I have uploaded a screenshot of the SUMMARY tab (LCP and FCP) with the LCP being smaller. I have also uploaded a screenshot of the DevTools output showing the LCP being higher (for the same run).
And just for completeness I have also added the output from the run as a zip!
Let me know if you need more info!
What browser did you use?
Chrome
How to reproduce
docker run --shm-size=2g --rm -v /sitespeed.io:/sitespeed.io sitespeedio/sitespeed.io:23.1.0 https://www.emirates.com/ae/english/experience/ --browsertime.viewPort "1920x1080" --browsertime.appendToUserAgent " PTST"

Navigate to the SUMMARY tab for the page and note the LCP value being smaller than the FCP. Then download the timeline in Chrome Dev Tools and see the LCP is larger than the FCP (albeit by a very small amount).
Relevant log output
Google Chrome 98.0.4758.80
Mozilla Firefox 97.0
Microsoft Edge 98.0.1108.43
[2022-02-25 12:52:09] INFO: Versions OS: linux 3.10.0-1160.49.1.el7.x86_64 nodejs: v16.13.2 sitespeed.io: 23.1.0 browsertime: 15.1.1 coach: 7.1.0
[2022-02-25 12:52:09] INFO: Running tests using Chrome - 3 iteration(s)
[2022-02-25 12:52:10] INFO: Testing url https://www.emirates.com/ae/english/experience/ iteration 1
[2022-02-25 12:52:29] INFO: Take after page complete check screenshot
[2022-02-25 12:52:30] INFO: Take cumulative layout shift screenshot
[2022-02-25 12:52:31] INFO: Take largest contentful paint screenshot
[2022-02-25 12:52:34] INFO: Get visual metrics from the video
[2022-02-25 12:52:41] INFO: https://www.emirates.com/ae/english/experience/ TTFB: 565ms DOMContentLoaded: 2.20s firstPaint: 1.52s FCP: 1.52s LCP: 1.39s Load: 3.23s TBT: 485ms CLS:0.0002
[2022-02-25 12:52:41] INFO: VisualMetrics: FirstVisualChange: 1.87s SpeedIndex: 3.42s VisualComplete85: 3.90s LastVisualChange: 3.90s
[2022-02-25 12:52:42] INFO: Testing url https://www.emirates.com/ae/english/experience/ iteration 2
[2022-02-25 12:53:01] INFO: Take after page complete check screenshot
[2022-02-25 12:53:02] INFO: Take cumulative layout shift screenshot
[2022-02-25 12:53:02] INFO: Take largest contentful paint screenshot
[2022-02-25 12:53:06] INFO: Get visual metrics from the video
[2022-02-25 12:53:13] INFO: https://www.emirates.com/ae/english/experience/ TTFB: 549ms DOMContentLoaded: 2.25s firstPaint: 1.48s FCP: 1.48s LCP: 1.35s Load: 3.20s TBT: 478ms CLS:0.0001
[2022-02-25 12:53:13] INFO: VisualMetrics: FirstVisualChange: 1.73s SpeedIndex: 3.29s VisualComplete85: 3.77s LastVisualChange: 3.77s
[2022-02-25 12:53:14] INFO: Testing url https://www.emirates.com/ae/english/experience/ iteration 3
[2022-02-25 12:53:33] INFO: Take after page complete check screenshot
[2022-02-25 12:53:34] INFO: Take cumulative layout shift screenshot
[2022-02-25 12:53:35] INFO: Take largest contentful paint screenshot
[2022-02-25 12:53:38] INFO: Get visual metrics from the video
[2022-02-25 12:53:45] INFO: https://www.emirates.com/ae/english/experience/ TTFB: 588ms DOMContentLoaded: 2.24s firstPaint: 1.48s FCP: 1.48s LCP: 1.38s Load: 3.21s TBT: 469ms CLS:0.0001
[2022-02-25 12:53:45] INFO: VisualMetrics: FirstVisualChange: 1.77s SpeedIndex: 3.41s VisualComplete85: 3.90s LastVisualChange: 3.90s
[2022-02-25 12:53:45] INFO: https://www.emirates.com/ae/english/experience/ 84 requests, TTFB: 565ms (σ16.00ms), firstPaint: 1.48s (σ19.00ms), firstVisualChange: 1.77s (σ57.00ms), FCP: 1.48s (σ19.00ms), DOMContentLoaded: 2.24s (σ21.00ms), LCP: 1.38s (σ17.00ms), CLS: 0.0001 (σ0.00), TBT: 478ms (σ7.00ms), Load: 3.21s (σ11.00ms), speedIndex: 3.41s (σ62.00ms), visualComplete85: 3.90s (σ63.00ms), lastVisualChange: 3.90s (σ63.00ms) (3 runs)
[2022-02-25 12:53:48] INFO: HTML stored in /sitespeed.io/sitespeed-result/www.emirates.com/2022-02-25-12-52-09
Hi @shaqb removing the bug for now until I verified, there's so much going on in Chrome so ...
if you look at the filmstrip, is the LCP choosing the correct element at the correct time? We use the https://developer.mozilla.org/en-US/docs/Web/API/LargestContentfulPaint API to get the data from Chrome, but my guess is that the Chrome trace log uses trace events so there's probably some missmatch going on there? Potentially there could be a diff if you have iframes etc but you can verify that by checking what element it reports as LCP.
Then there's the thing with Paint Holding in Chrome, I'm not sure the metrics are reported correctly anymore, checkout https://bugs.chromium.org/p/chromium/issues/detail?id=1291502
Hey @soulgalore - no worries at all.
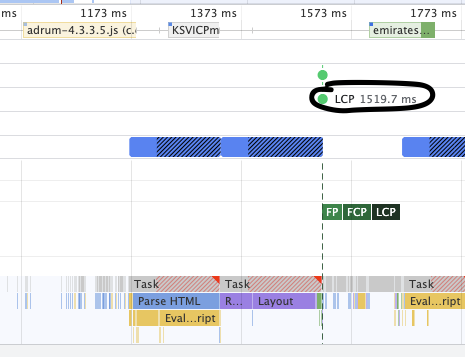
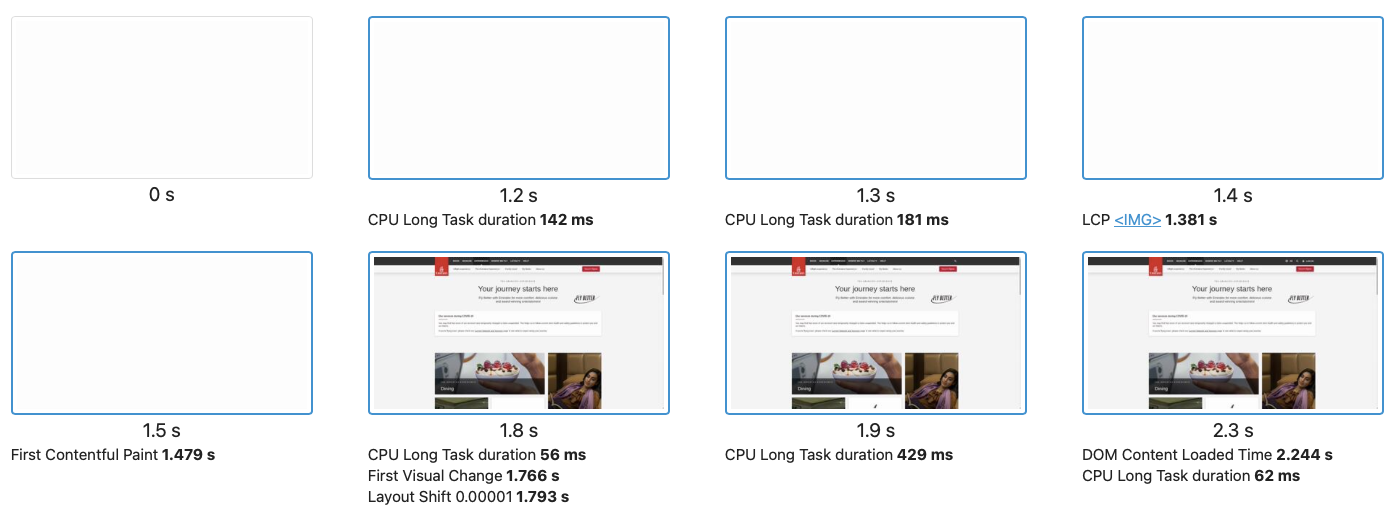
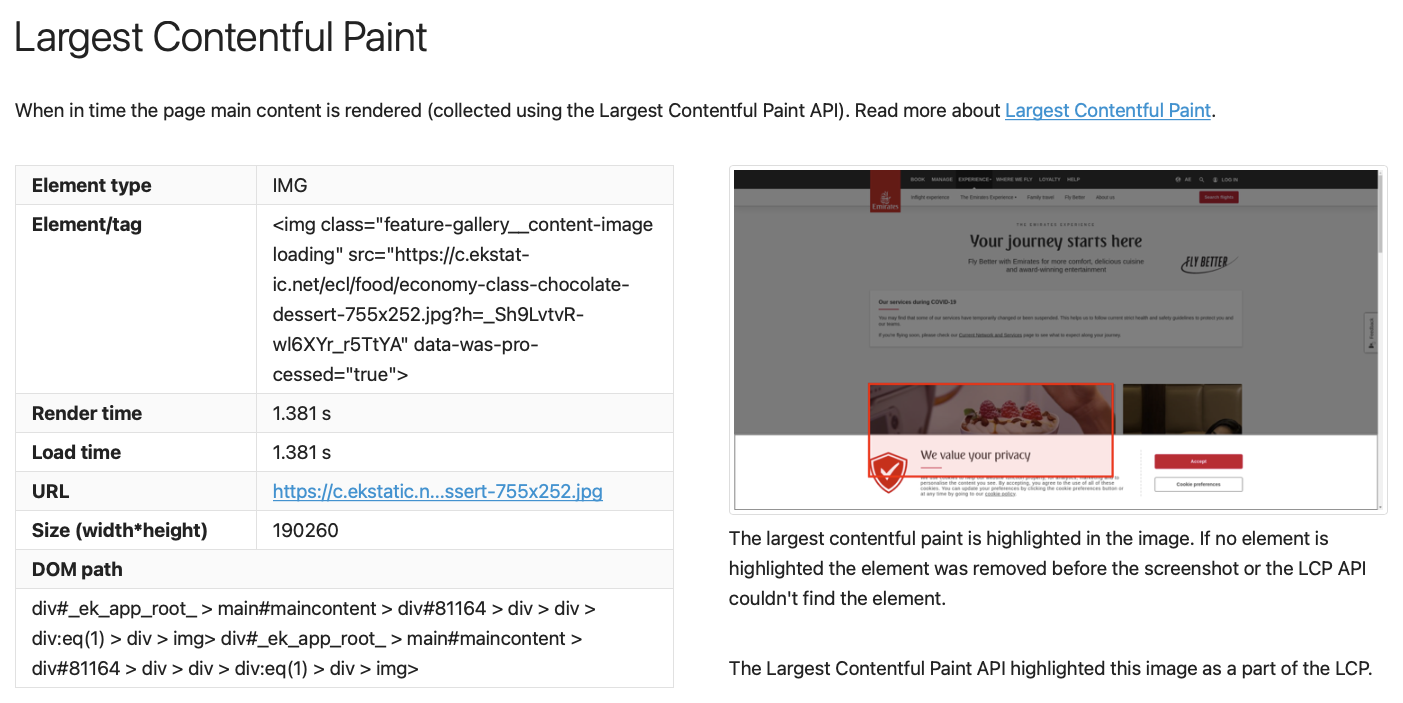
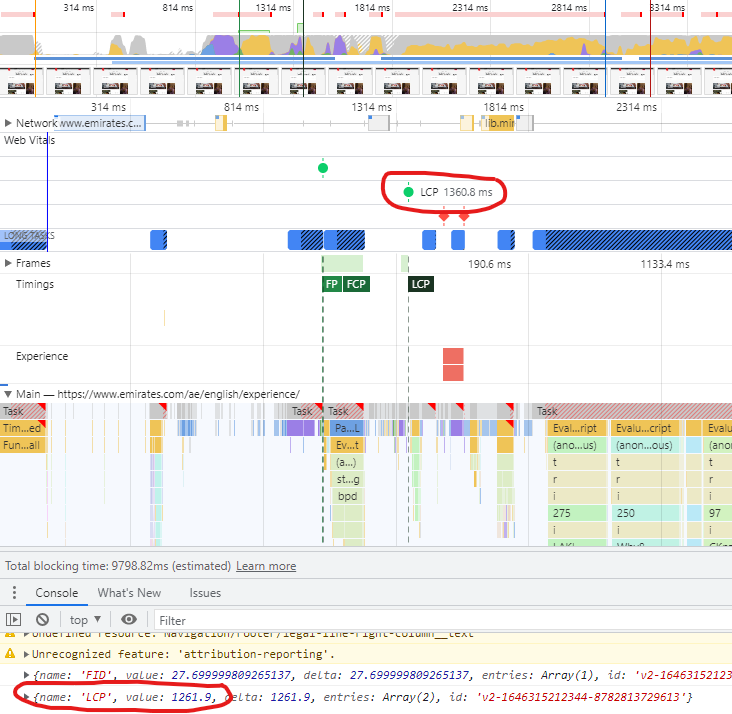
Looking at the flimstrip I can see it's definitely picking the correct element (an image) but the timing is off. See below:
And I can see this correctly matches the LCP from the Metrics tab albeit still with the lower LCP value:
What's interesting (and it corresponds to the bug report you have submitted to Chromium) is that the FCP/LCP from the API or from DevTools are both faster than what is coming from the video).
So I did some testing with previous versions of Chrome (10 iterations) and this is the outcome:
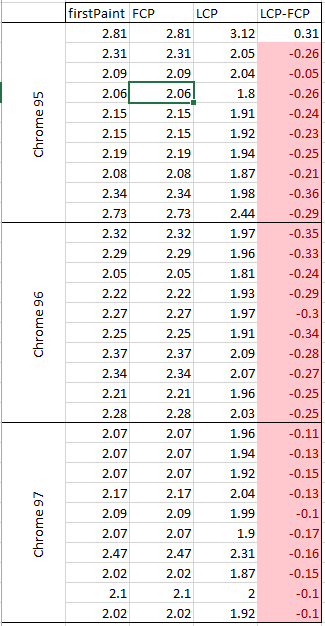
So I think even with the most recent changes in Chrome 97, we were still seeing the LCP being lower than the FCP.
Thanks @shaqb I'll look into it after I'm back from a short vacation. Looking at the filmstrip, yep its the same thing I've seen on Wikipedia (where the metrics are off from when the change really happens)? Adding --browsertime.chrome.args disable-features=PaintHoldingCrossOrigin fixes that for me.
For the LCP/FCP diff, don't you get the same if you access the page in Chrome and get the FCP and LCP from the JavaScript console? Thinking if that's so, it would be easy to report to Chrome. I did some tests on my computer and there I can reproduce what you get. What's also seems like a bug is that I also get that image as LCP but on my small screen I don't see that. Let me try some more.
@shaqb do you get the same result if you leave out the extra user agent? I've been trying running with/without Docker and using Chrome headless. For me I get the to early LCP if I add the extra user agent or if you use Chrome headless switch (that adds headless to the user agent). If I do not add them, LCP is always larger than FCP (at least for the 10+ try I did).
@shaqb do you get the same result if you leave out the extra user agent? I've been trying running with/without Docker and using Chrome headless. For me I get the to early LCP if I add the extra user agent or if you use Chrome headless switch (that adds headless to the user agent). If I do not add them, LCP is always larger than FCP (at least for the 10+ try I did).
Hi @soulgalore - looks like it happens all the time with the extra agent but far less frequently without
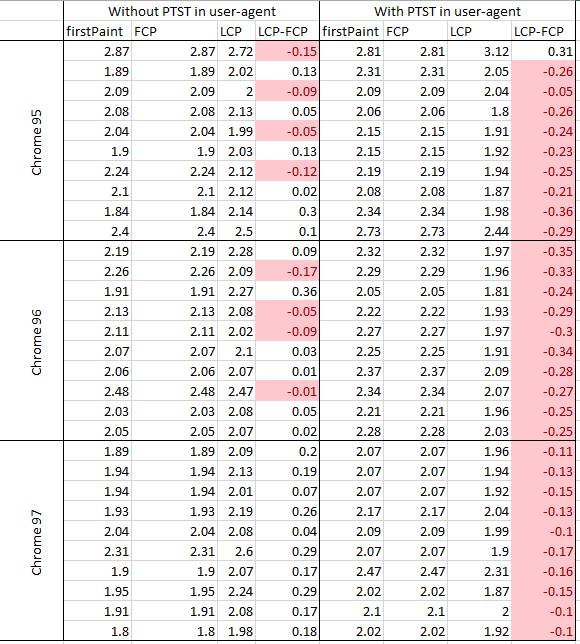
As the append functionality wasn't there in sitespeed.io 20.3.0 (Chrome 95) and 20.6.0 (Chrome 96) I used --browsertime.userAgent instead. I used the following configs:
Chrome 95:
{
   "browsertime":{
      "iterations": 10,
      "browser":"chrome",
      "connectivity.engine":"throttle",
      "connectivity.profile":"cable",
      "viewPort":"1920x1080",
      "userAgent":"Mozilla/5.0 (Windows NT 10.0; Win64; x64) AppleWebKit/537.36 (KHTML, like Gecko) Chrome/95.0.4638.69 Safari/537.36 PTST"
   }
}
docker run --shm-size=2g --rm -v /sitespeed.io:/sitespeed.io: sitespeedio/sitespeed.io:20.3.0 https://www.emirates.com/ae/english/experience/ --config chrome95.json
Chrome 96:
{
   "browsertime":{
      "iterations": 10,
      "browser":"chrome",
      "connectivity.engine":"throttle",
      "connectivity.profile":"cable",
      "viewPort":"1920x1080",
      "userAgent":"Mozilla/5.0 (Windows NT 10.0; Win64; x64) AppleWebKit/537.36 (KHTML, like Gecko) Chrome/96.0.4664.110 Safari/537.36 PTST"
   }
}
docker run --shm-size=2g --rm -v /sitespeed.io:/sitespeed.io: sitespeedio/sitespeed.io:20.6.0 https://www.emirates.com/ae/english/experience/ --config chrome96.json
Chrome 97
{
   "browsertime":{
      "iterations": 10,
      "browser":"chrome",
      "connectivity.engine":"throttle",
      "connectivity.profile":"cable",
      "viewPort":"1920x1080",
      "userAgent":"Mozilla/5.0 (Windows NT 10.0; Win64; x64) AppleWebKit/537.36 (KHTML, like Gecko) Chrome/97.0.4692.71 Safari/537.36 PTST"
   }
}
docker run --shm-size=2g --rm -v /sitespeed.io:/sitespeed.io: sitespeedio/sitespeed.io:23.1.0 https://www.emirates.com/ae/english/experience/ --config chrome97.json
So is the web site trying to game LCP (since it also happens with headless), I haven't looked at the actual code? Or do you think it's a bug? I'll have a look again this weekend when I'm back.
Hi @soulgalore - looks like in the console I am seeing the same. For example:
{name: 'FCP', value: 525.2999999988824, delta: 525.2999999988824, entries: Array(1), id: 'v2-1646300779538-7760570784283'}
{name: 'LCP', value: 516.099, delta: 516.099, entries: Array(1), id: 'v2-1646300779539-7302021526651'}
That is without the additional header and on Chrome 99, so feels like it could be a Chrome bug?
Here's a better example @soulgalore
Anyway - enjoy your vacation! Let me know where to raise the bug with Chrome and I will get it raised there.
Hi @shaqb thanks, I'm back now. Ok, so do I understand correctly if the trace in devtools is correct but the LCP API gives the wrong number? Arr you in the webperformance.slack.com Slack channel? If not, join and as Yoav directly, I think he implemented it and is interested if there are some edge cases + understands that better than me :)
I can change so we get the LCP number from the trace log from Chrome instead. Would be interesting to know if the Chrome User Experience data get the metric from Chrome or from the API, I think the question was asked on the Slack channel before so I'll have a look.
Ok, the experience report uses the Chrome built in so let me fix so we pickup LCP from the trace.
I did some test with https://chromedevtools.github.io/devtools-protocol/tot/PerformanceTimeline/ (instead of parsing the log) and that works fine, but for the use case when using --headless it seems that only an event for the image is fired and not the cookie banner. The image event has only loading (and not rendered) and I'm thinking maybe that's the case for you too? In your example in https://github.com/sitespeedio/sitespeed.io/issues/3583#issuecomment-1058064347 could you see exact which events the LCP array has?
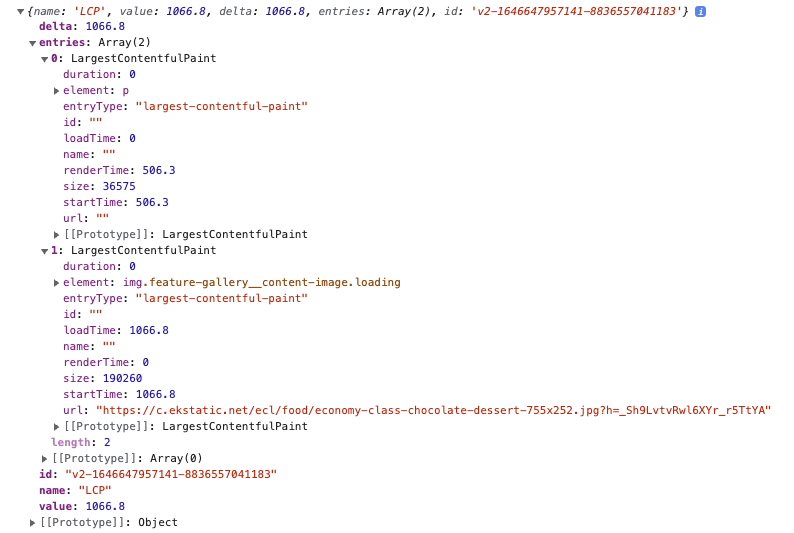
I get the same thing as you. Checked the LCP API:
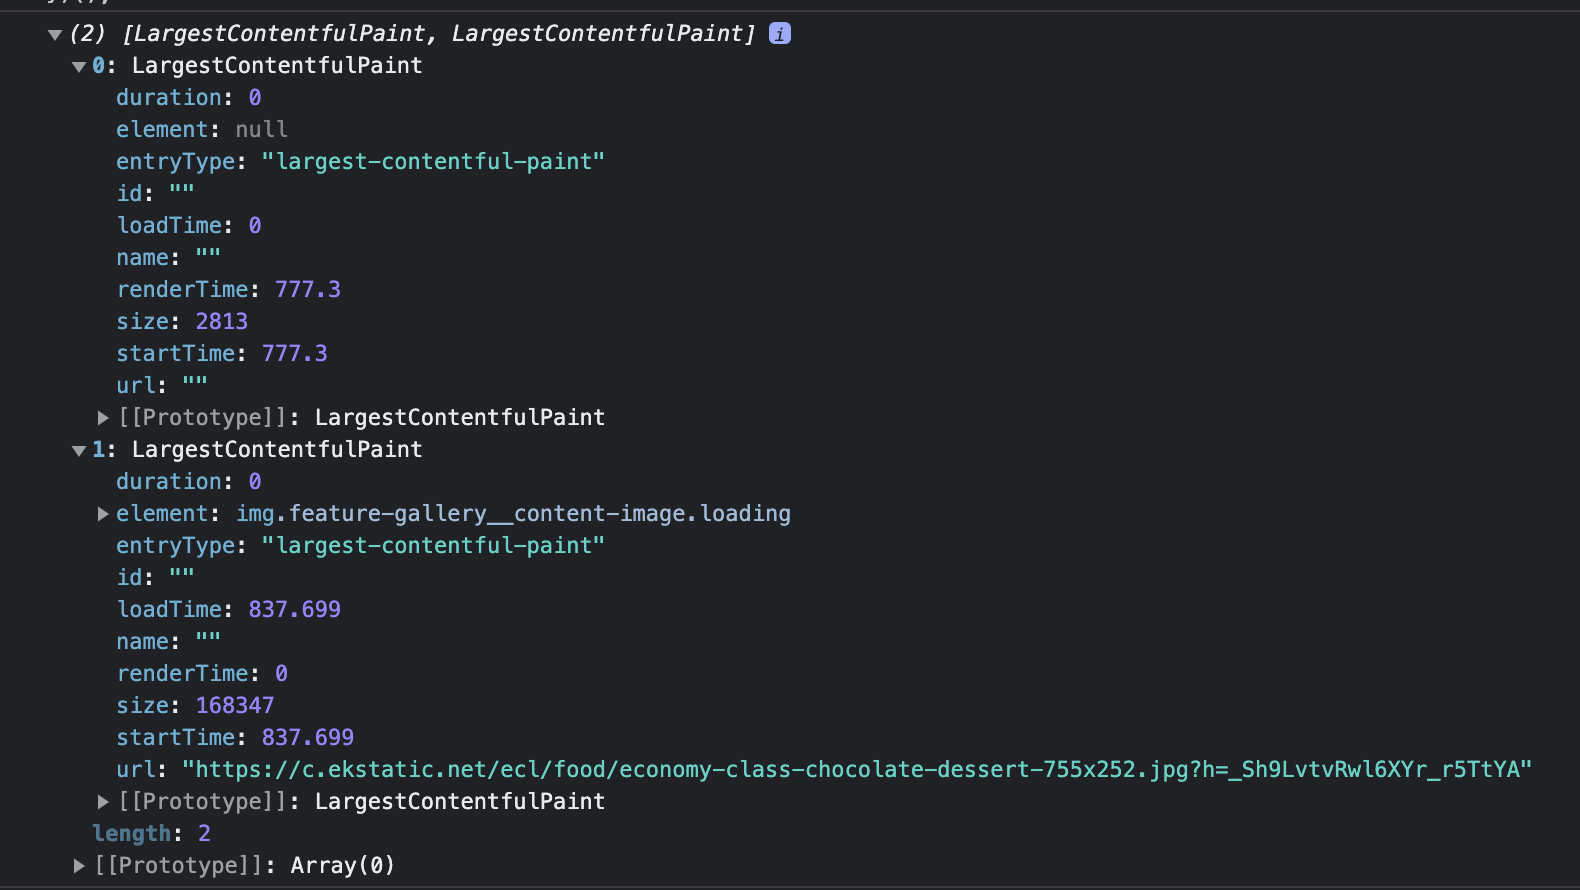
But the banner is not reported.
number? Arr you in the webperformance.slack.com Slack channel? If not, join and as Yoav directly, I think he implemented it and is interested if there are some edge cases + understands that better than me :)
I can change so we get the LCP number from the trace log from Chrome instead. Would be interesting to know if the Chrome User Experience data get the metric from Chrome or from the API, I think the question was asked on the Slack channel before so I'll have a look.
Thanks @soulgalore - I can't seem to join - are you able to send an invite link?
Ok, the experience report uses the Chrome built in so let me fix so we pickup LCP from the trace.
Hey @soulgalore - I hope you had a nice break! Let me know if you need some support in testing this!
@shaqb I'll can send an invite, send me your email address peter AT souldgalore.com.
I haven't tested anymore. The case when I reproduced running headless then there where no LCP event in the trace log for the banner but I could verify in the screenshot that it was there. I can try with running in Docker too the way you do in some time.
Let me do a summary after talking to @shaqb on Slack: The problem in this case is that the LCP API only deliver a loading time for the image and not the render time, and that gives the wrong metrics (and the reason is probably because its served from another domain that do not have Timing-Allow-Origin. I did some tries with the CDP API but I get the same problem there. I wonder if we need to get the trace log and parse it ourselves.
Hi @soulgalore - what's your view? To get the detail from the trace as with this particular use case (separate domain for static content) the API is only reporting the load time and not the render time?
I think this is more an issue for Chrome? Maybe it has been solved? Also I would use --visualElements in this case since it will get the metric from the video.