Using plot_diff to compare DataFrames
Summary
The principle of the feature is to provide an high-level API getting the difference between similar DataFrames. It also works on the subsets of a single DataFrame.
Design-level Explanation Actions
- [x] Design the overall architecture of the
plot_diff - [x] Use the existing components as the reference.
- [x] Render the prototype.
- [ ] Polish the detail for each API
Design-level Explanation
plot_diff([df1, df2, ..., dfn])
# This will show the summary of all DataFrames, it's similar to what we already have in plot(df).
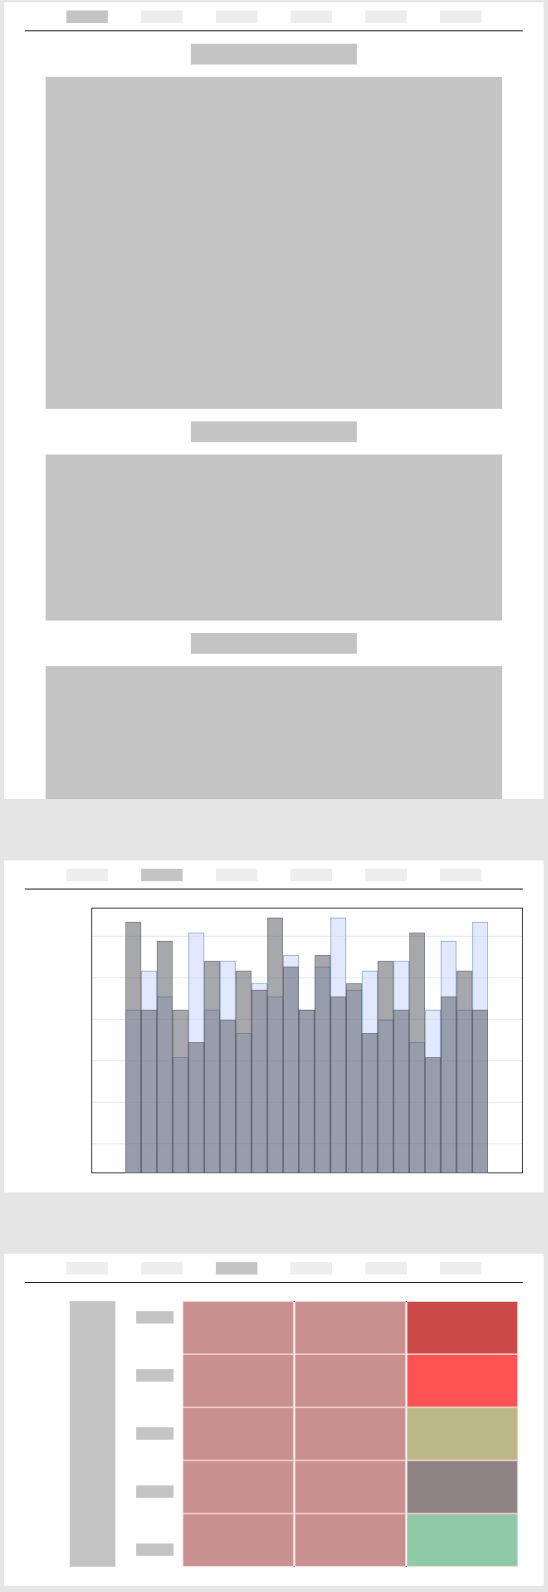
UI mock up:

plot_diff([df1, df2, ..., dfn], x)
# This will show the difference between the DataFrames on a specific column, if the column exists at least in one of the dfs.
# Including the distribution and correlations.

plot_diff(df, x, ["cat_1", "cat_2"])
# This will compare the subsets of a single DataFrame
# by querying categorical variable into two categories, it's similar to what plot_diff(df1, df2, x) does.

plot_diff(df, x, ["[0:100]", "[100:200]"])
# This will compare the two subsets of a single DataFrame
# by slicing the numerical variable in the given window, it's similar to what plot_diff(df1, df2, x) does.

plot_diff(df, x, ["[2020-01-01:2020-07-01]", "[2020-07-01:2021-01-01]"])
# This will compare the two subsets of a single DataFrame
# by slicing the time related data in the given window, it's similar to what plot_diff(df1, df2, x) does.
 If the two dfs' column names are identical or have some intersection or have inclusion relationship, they are comparable.
Implementation-level Explanation
WIP
Rational and Alternatives
WIP
Prior Art
Using existing components from plot(df) and plot(df, x)
We also use sweetviz as the reference for prototyping.
Future Possibilities
Better way to determine if the given DataFrames are comparable.
Implementation-level Actions
Additional Tasks
- [x] This task is put into a correct pipeline (Development Backlog or In Progress).
- [x] The label of this task is setting correctly.
- [x] The issue is assigned to the correct person.
- [x] The issue is linked to related Epic.
- [ ] The documentation is changed accordingly.
- [ ] Tests are added accordingly.
Looks nice!
A reference for dataframe comparison: https://towardsdatascience.com/powerful-eda-exploratory-data-analysis-in-just-two-lines-of-code-using-sweetviz-6c943d32f34
The slicing functionality may be complicated to understand for users.
Besides, not sure whether we also need to consider row-wise dataframe comparison.
Ya nice job Ling! I think all of the tasks you listed are important. Also, for your consideration, here's a thread from Jiannan's reddit post that gives some ideas for plot_diff.