Extraction of loss values of the Generator and Discriminator when using CTGAN
Problem Description
When I used CTGAN to synthesize the new data, I found that the loss values of Generator and Discriminator can be seen using the argument: verbose=True. However, the loss values are not able to be extracted as numbers. Since I am willing to create a visualization of the changing progress of the G loss and D loss, I wonder if you can provide any function/method to do it.
Expected behavior
I hope there is a function that can extract the G loss and D loss as a list, pd.DataFrame, or NumPy.
Many thanks!
Additional context
<Please provide any additional context that may be relevant to the issue here. If none, please remove this section.>
Thanks for filing @1Biaohe. I'll mark this as a feature request. We'll keep this issue open for tracking. You'll see updates on it as we make progress.
To help us prioritize, it's always great if you're able to speak more about your use case. How are you planning to use the synthetic data and how will the visualization function help?
Thanks for the reply!
What I want to do is to observe the tendency of the D and G loss when training a CTGAN model. This can help me to determine how many epochs I need to set. When I trained CTGAN with my data (only 21 samples), I found that the more epochs, the better the results. For example, I tried 1000 and 5000 epochs, and the evaluation results of 5000 are better than that of 1000 (with 300 synthetic samples). So, I want to figure out if the G loss or D loss did not converge when the epochs are 1000. This is why I request a function that can visualize the change of G loss and D loss.
Thanks! Biao He
Hi everyone, related to this, I was wondering whether it would also be helpful to split the G loss into the real generator and cross-entropy loss? The cross-entropy loss dominates the G loss in the beginning and rapidly decreases to zero, which may give a confusing plot in the end.
FYI we have just published a discussion on the CTGAN loss values and how the relate to overall synthetic data quality: https://bit.ly/demystify-ctgan-discussion
You may find these learnings interesting to diagnose your model. There is also some code in the associated Colab Notebook for extracting and plotting the loss values. This is a manual process, so we'll keep this issue open for adding a convenience method for plotting it.
Hi everyone, since we have now released an SDV 1.0 library with improved API, I wanted to provide an updated workaround if you want to save loss values and plot them.
Step 1: Create a CTGAN synthesizer
Make sure you set verbose=True so the loss values are printed out.
from sdv.datasets.demo import download_demo
from sdv.single_table import CTGANSynthesizer

data, metadata = download_demo(
    modality='single_table',
    dataset_name='fake_hotel_guests'
)

synthesizer = CTGANSynthesizer(metadata, epochs=100, verbose=True)
Step 2: Fit the synthesizer
Save the verbose output as it's fitting. In a iPython notebook, you should be able to use %%capture output to save the printed loss values to a variable named output.
%%capture output
synthesizer.fit(data)
Step 3: Format the loss values as a table
Using the code below, you can extract the values and save them as a table.
import pandas as pd
# Format the output into a table named loss_values
epochs_output = str(output).split('\n')
raw_values = [line.split(',') for line in epochs_output]
loss_values = pd.DataFrame(raw_values)[:-1]
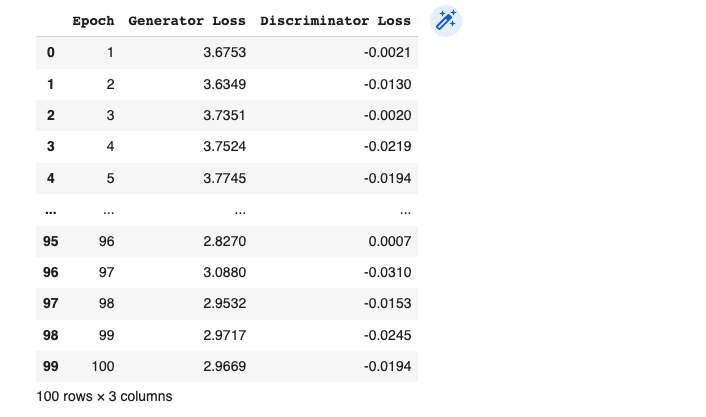
loss_values.columns = ['Epoch', 'Generator Loss', 'Discriminator Loss']
loss_values['Epoch'] = loss_values['Epoch'].str.extract('(\d+)').astype(int)
loss_values['Generator Loss'] = loss_values['Generator Loss'].str.extract('([-+]?\d*\.\d+|\d+)').astype(float)
loss_values['Discriminator Loss'] = loss_values['Discriminator Loss'].str.extract('([-+]?\d*\.\d+|\d+)').astype(float)
The loss_values variable is a table that shows the values per epoch.
(Optional) Step 4: Plot Values
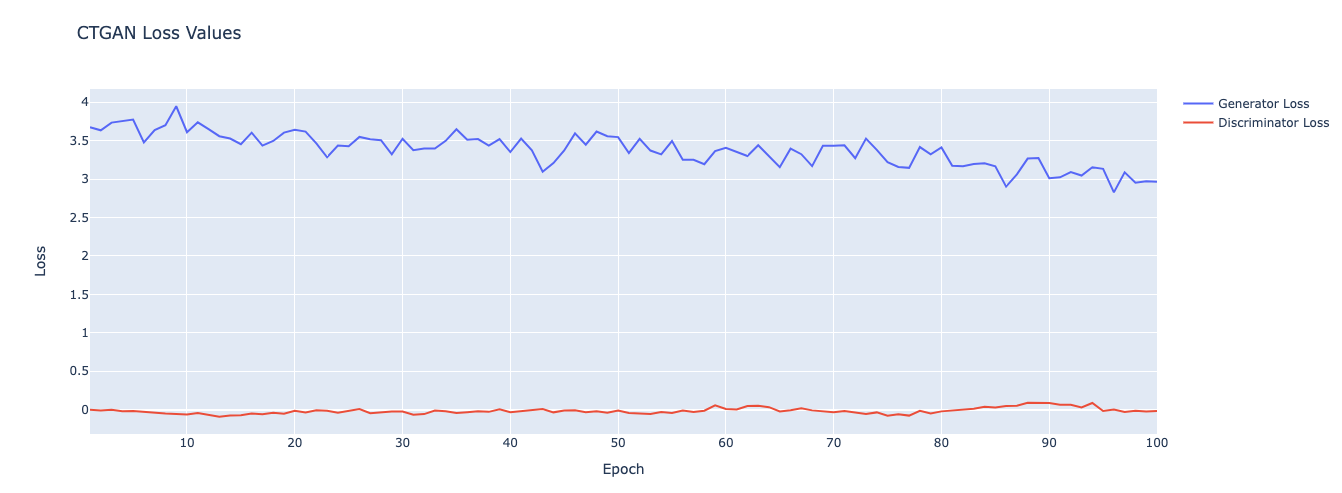
You can use a graphing library such as plotly to plot the values from the table.
import plotly.graph_objects as go

# Graph the table
fig = go.Figure(data=[go.Scatter(x=loss_values['Epoch'], y=loss_values['Generator Loss'], name='Generator Loss'),
                      go.Scatter(x=loss_values['Epoch'], y=loss_values['Discriminator Loss'], name='Discriminator Loss')])

fig.update_layout(title='CTGAN Loss Values', xaxis_title='Epoch', yaxis_title='Loss')
fig.show()
Hi everyone, we have a proposed API in CTGAN issue #298 that will allow us to more easily return discriminator/general loss values.
We'll continue to keep this open until the underlying CTGAN issue has been resolved.
do you have plans to include this feature in the CTGANSynthesizer as part of sdv.single_table? More generally, can you help me understand why SDV has 2 CTGAN packages (/CTGAN/ctgan/synthesizers/ctgan.py) and (SDV/sdv/single_table/ctgan.py)?
Hi @jonlatner nice to meet you. This is a very timely Q. We do, indeed, have plans to include this feature in the CTGANSynthesizer and we appreciate your patience as we work on this.
I've filed a feature request in #1671 to allow easy access to loss values for all of our GAN-based synthesizers (CTGAN, TVAE, PAR, etc.)
Improved Workaround for SDV 1.6.0+
The latest SDV (1.6.0) was just released today. In this version, it's even easier to access the loss values from CTGAN. The are available as a parameter of the underlying ML model.
from sdv.single_table import CTGANSynthesizer

synthesizer = CTGANSynthesizer(metadata, epochs=10)
synthesizer.fit(data)

# access loss values from the ML model directly
loss_values = synthesizer._model.loss_values
To plot the loss values, you can reformat the DataFrame and use a plotting library such as plotly.
import pandas as pd
import plotly.express as px

loss_values_reformatted = pd.melt(
    loss_values,
    id_vars=['Epoch'],
    var_name='Loss Type'
)

fig = px.line(loss_values_reformatted, x="Epoch", y="value", color="Loss Type", title='Epoch vs. Loss')
fig.show()
CTGAN vs. CTGANSynthesizer
can you help me understand why SDV has 2 CTGAN packages
The CTGAN repository has the core ML model and algorithmic components corresponding to the original CTGAN paper. The SDV library (this one) is a broader library for all your synthetic data needs -- offering many different synthesizers, data cleanup/preprocessing, data evaluation etc. The CTGANSynthesizer wraps around CTGAN.
We recommend using the SDV library, as it's meant to be a more easy-to-use interface. For more info, see SDV docs.
Hey y'all! We've since added the ability to access the loss values from CTGANSynthesizer itself, documented here:
https://docs.sdv.dev/sdv/single-table-data/modeling/synthesizers/ctgansynthesizer#get_loss_values
I'm closing / resolving this issue. Also, I opened a new issue for just the loss value visualization part of this, which we can track here: https://github.com/sdv-dev/SDV/issues/1828