Adding additional info for channels + option to leverage this info for visualisation purposes
Type of the feature
- [x] New function in
sqduipy.im? - [ ] New function in
squidpy.gr? - [ ] New function in
squidpy.pl? - [ ] Change an existing functionality, such as default behavior?
- [ ] Other?
Description
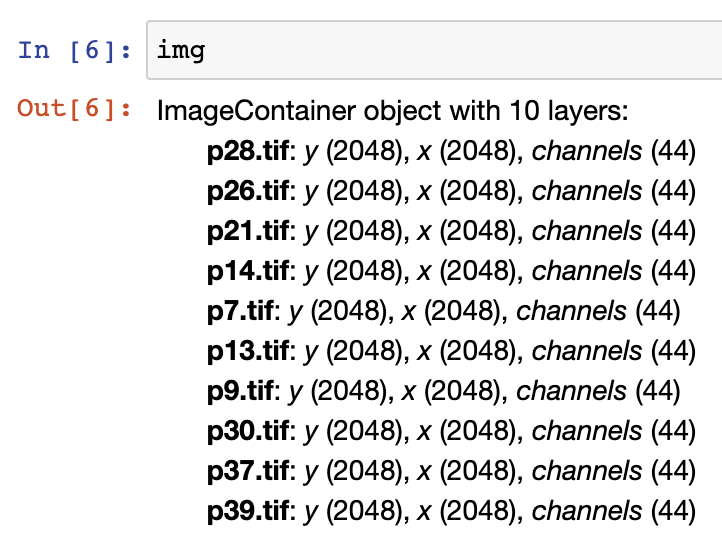
For some image data the channels have biological meaning, therefore, it would be great to be able to map this to the respective channels. In this dataset I have 44 channels where each one corresponds to some measurement, for example: dsDNA, CD41, Au, ...
 I could think of a pandas dataframe that is available as
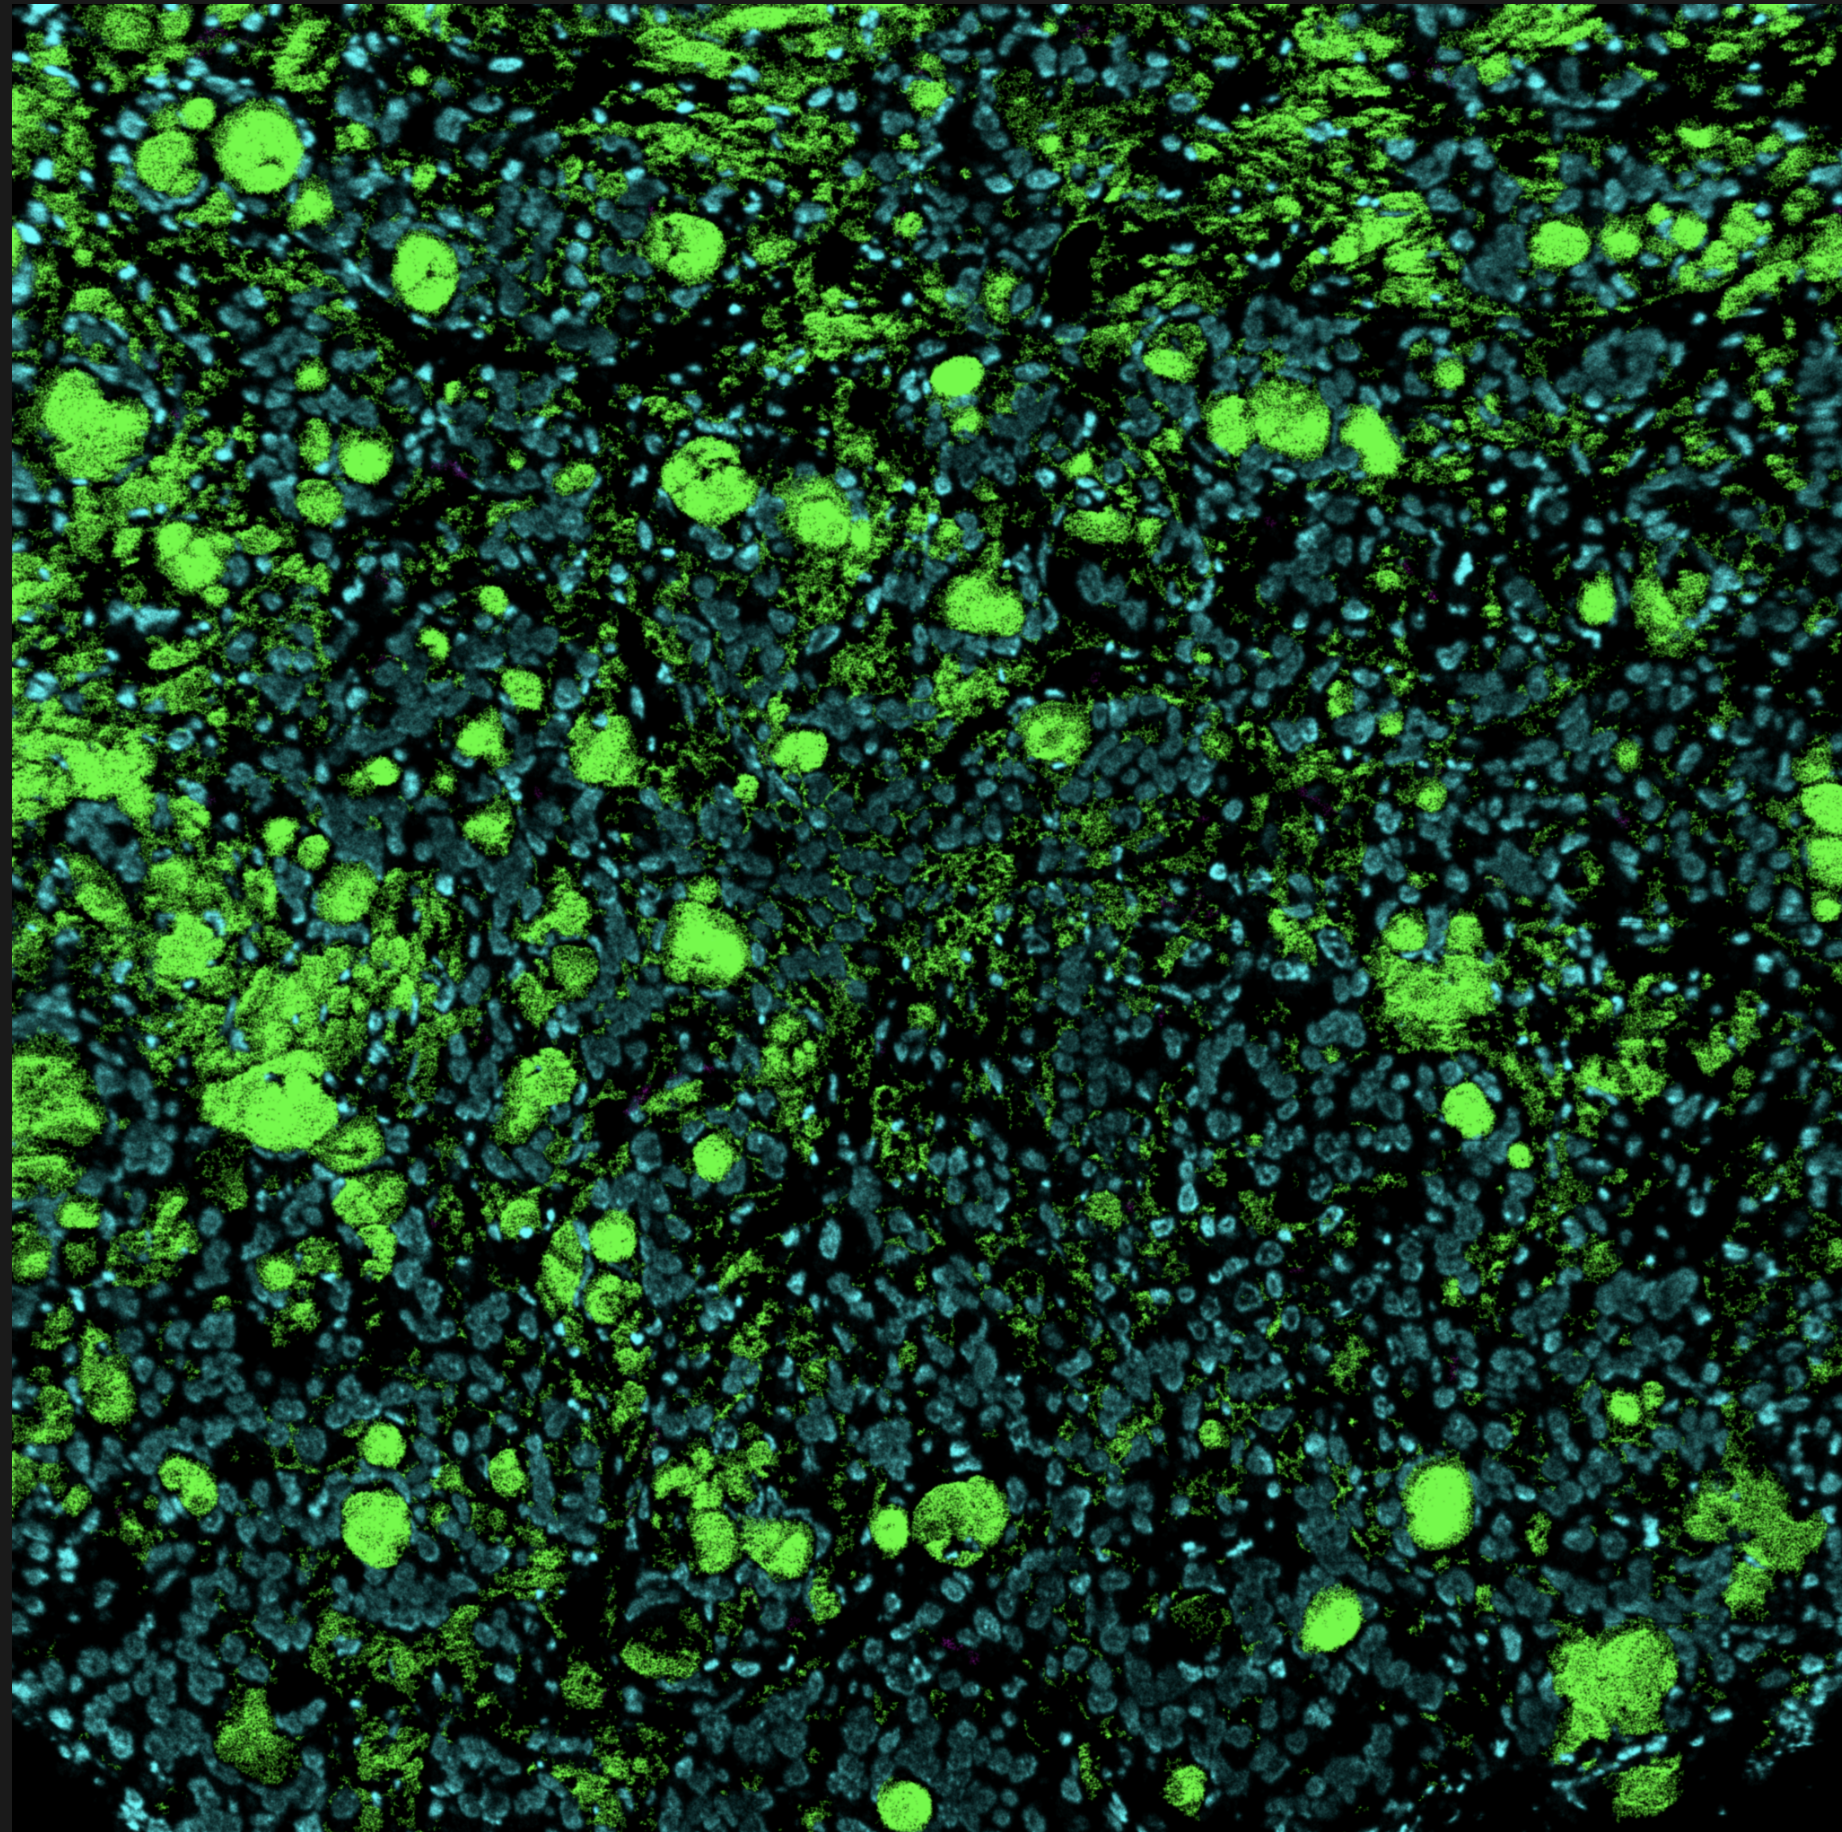
 img.channels where the index corresponds to the above mentioned measurements (similar to adata.obs_names) and additional columns could be used for other purposes. For example plotting: One could add rgb values for each channel in the colour column of the dataframe and then subset to a list of channels. This would allow to simultaneously plot multiple channels (>3) (with the alpha value being the [0,1] ranged value in the provided image data), like so:
thanks for this suggestion @MxMstrmn! Storing additional information related to ImageContainer channels sounds like a good idea. I'd propose to internally store this in as a coordinate (or potentially somewhere else more appropriate?) in the DataArray. We can then of course map img.data.coords['channels'] to img.channels, with a setter as well.
E.g. assigning channels names could look like as follows:
import squidpy as sq
img = sq.datasets.visium_fluo_image_crop()
img._data = img.data.assign_coords(channel_names = ('channels', ['DAPI', 'FLUO1', 'FLUO2']))
Adding a rgb column as well would be possible for nicer plotting!
I'm not entirely sure if putting all this information in img.data.coords is sensible from an implementation perspective but maybe @michalk8 knows?
Btw, it is also possible to convert between array and pandas easily, like here: img.data.coords['channels'].to_dataframe().
I'm just not sure how to convert it back and store an updated data frame in img.data.coords['channels']. Otherwise this would be a good clean option imo.
I think this would still add some value to the plotting capabilities of squidpy (more channels than 3). I recently ran into a similar problem and would be happy to help implementing this.
I would need some guidance though where to store the channel information. @michalk8, does @hspitzer idea still apply, any thoughts? Thanks 🙏
closing due to inactivity, feel free to reopen (although I feel most of this will be sealed with in spatialdata)