scanpy

scanpy copied to clipboard
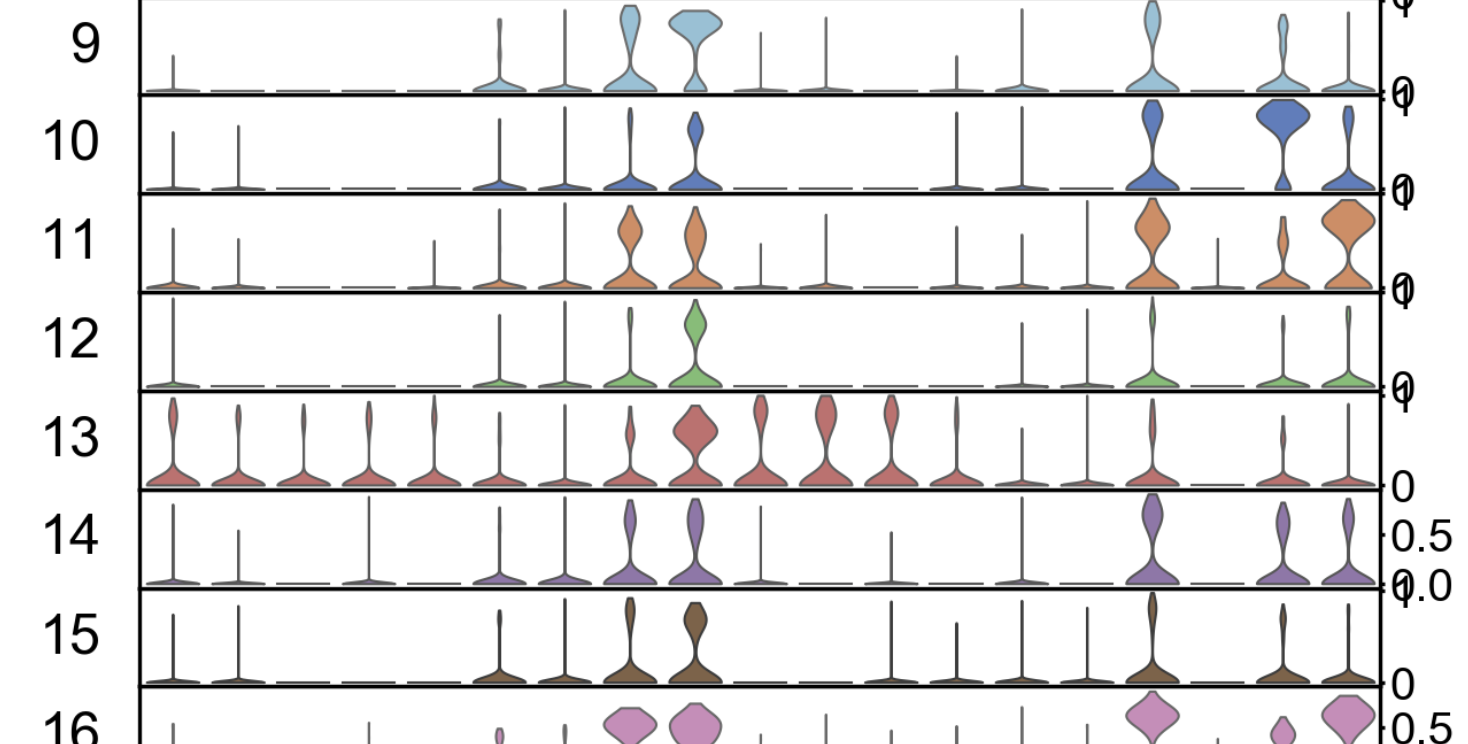
sc.pl.stacked_violin overplotting of y-axis scale
Especially when using standard_scale = 'var', the scale values obscure each other if values are '0' and '1'. Is there a way to allow for off-center plotting of the scale values? Minimizing the font size helps somewhat but is far from ideal.
...
sc.settings.set_figure_params(dpi=150)
sc.pl.stacked_violin(adata, marker_genes, groupby='louvain', rotation = 90, standard_scale = 'var'
...
Output:
Versions:
<scanpy==1.4.4.post1 anndata==0.6.22.post1 umap==0.3.9 numpy==1.15.4 scipy==1.3.0 pandas==0.23.4 scikit-learn==0.20.2 statsmodels==0.10.2 python-igraph==0.7.1 louvain==0.6.1>
