Trouble with interpretation
Hello,
I am trying to understand the output from samplot for some SV calls, but am having trouble with interpretation. Any help would be greatly appreciated.
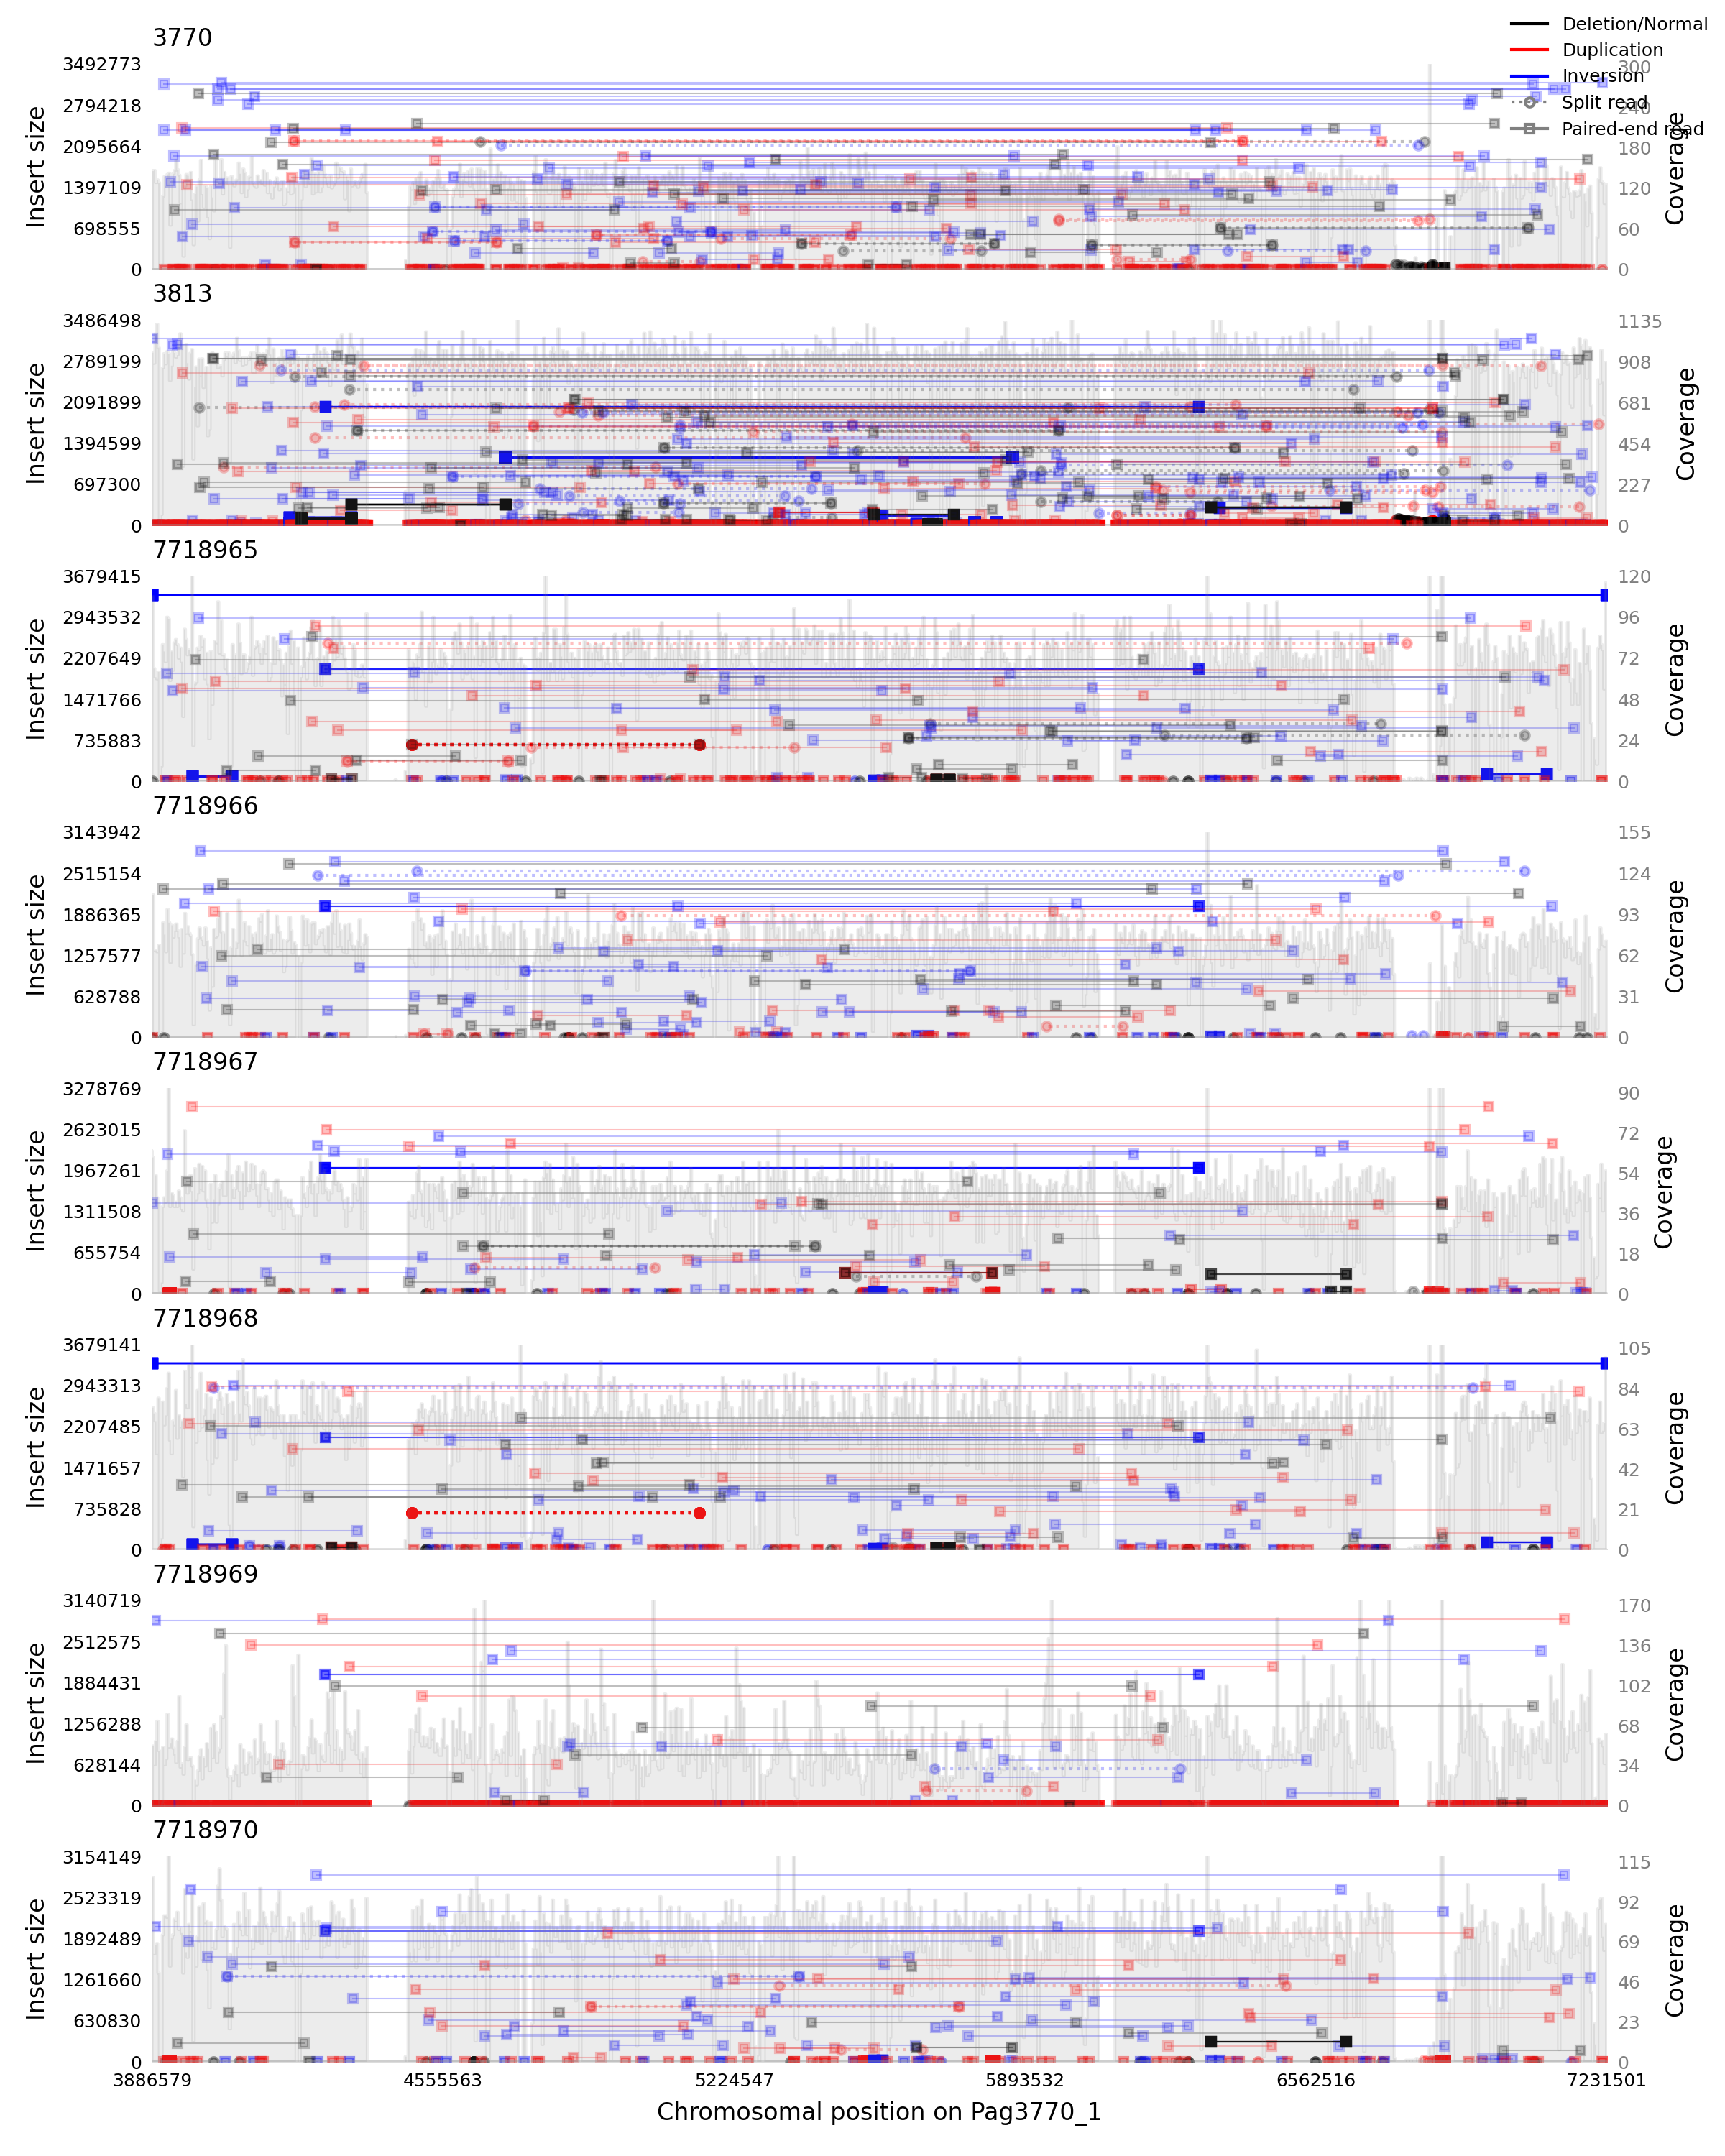
For example, an inversion SV of size 3344922 bp was called in 7718965 and 7718968 of the samples, but I see only 1 pair of reads supporting this SV in those 2 samples. Or are there multiple reads that are overlapping and therefore hiding from view? Does this image appear to be supporting the SV call?
Thanks so much for your time!
Diya
It might help to add the sv type to the plot command with the -t INV. That'll expand the window and show the breakpoints where the SV was called. The alpha value of the reads (how dark they are) indicates multiple reads being plotted on top of each other, so the two samples you indicate both appear to have multiple reads supporting the inversion.
You might also want to try the —jitter option thanks to @pontushojer