No RG field in alignment
Hi,
Thank you for the great program. While I am testing the samplot (v.1.2.0), I have bumped into a problem.
FYI, Target species: Plant Raw reads: PacBio Sequel Aligner: Generated a sorted.bam file using Minmap2 and samtools VCF: Generated vcf files using SVIM and CuteSV
After installing the program via Bioconda, I have executed this script.
conda activate samplot
samplot vcf
--filter "SVTYPE == 'DEL' & SU >= 8"
--filter "SVTYPE == 'INV' & SU >= 5"
--vcf /work/CTSV.vcf
-d LCTSV/
-O png
--important_regions /work/Plant.bed
-b /work/aln_Plant.sortedRG1.bam > samplot_commands.sh
conda deactivate
And, I have this error. No RG field in alignment file /work/aln_Plant.sortedRG1.bam. Include ordered list of sample IDs to avoid this error
To resolve this matter, I have used samtools from this link https://www.biostars.org/p/316486/. samtools view -h in.bam|awk '{ if($0 ~ "^@") {print $0} else {split($1,a,":"); gsub(/RG:Z:[^\t]*/, "RG:Z:"a[1]); print} }'|samtools view -b -o out.bam
However, it still shows the same error.
Any idea or suggestion would be really helpful.
Cheers,
Taek
samplot vcf is struggling to connect the samples in your VCF with the bam you included, a challenge when dealing with multiple bams. Check out the --sample_ids argument in the samplot vcf -h output.
Hope that solves it!
Thank you for your reply. I have tried again as you suggested.
conda activate samplot
samplot vcf --filter "SVTYPE == 'DEL' & SU >= 8" --filter "SVTYPE == 'INV' & SU >= 5" --vcf /work/CTSV.vcf -d LCTSV/ -O png --sample_ids LQMM2 --important_regions /work/Plant.bed -b /work/aln_Plant.sortedRG1.bam > samplot_commands.sh
conda deactivate
After this,
drwxrws--- 2 ozt5 Work 77 Jun 17 09:53 LCTSV -rwx------+ 1 ozt5 Work 1605 Jun 16 12:51 PBS_CuteSV_SamPlot.submit -rw-rw---- 1 ozt5 Work 0 Jun 16 12:55 samplot_commands.sh -rw------- 1 ozt5 default 84 Jun 16 19:19 SMPlot.o9617508
There was no error in SMPlot.o9617508 but it was empty in samplot_commands.sh.
And then, I can see an index.html file in LCTSV. -rw-rw---- 1 ozt5 Work 24507 Jun 16 19:18 index.html
When I clicked the index.html, it shows nothing. See below image file.
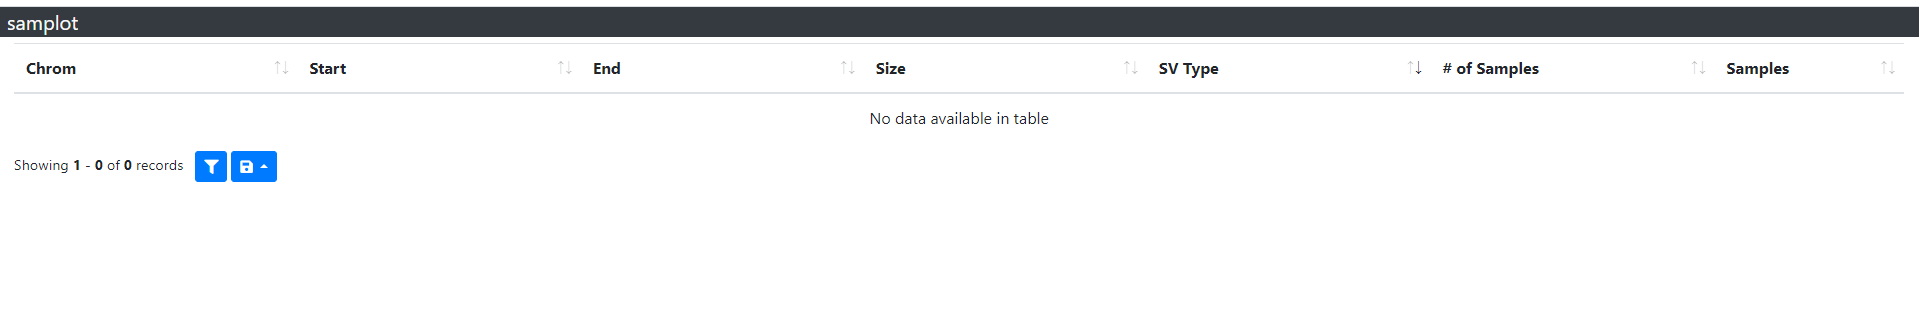
Did I miss something?
Looking forward to your reply!
Cheers
Hmm, hard to say. Try running again with the --debug option. That will output a message for most skipped variants explaining why they were skipped. Is it possible that there are no deletions or inversions passing the SU filters you've set?
Here is the second trial.
conda activate samplot
samplot vcf --filter "SVTYPE == 'DEL' & SU >= 8" --filter "SVTYPE == 'INV' & SU >= 5" --vcf /work/CTSV.vcf -d LCTSV -O png --sample_ids LQMM2 --debug --important_regions /work/Plant.bed -b /work/aln_Plant.sortedRG1.bam > samplot_commands.sh
conda deactivate
And, there was no luck. Please see the attached log file. Not sure whether there is a problem with the vcf file or the bed file. Any suggestion? SMPlot2_Log_Short.txt
Looks like the majority of the variants were excluded by the important_regions bed file. Maybe a good idea to test without that option to see what happens? It's possible that there's some problem with the bed file or vcf coordinate system but hard to tell from this info. Could you check to make sure that there are variants to plot within the regions in the bed file, and that the contig/chromosome ID matches?
Here is the third trial.
conda activate samplot
samplot vcf --filter "SVTYPE == 'DEL' & SU >= 8" --filter "SVTYPE == 'INV' & SU >= 5" --vcf /work/CTSV.vcf -d LCTSV -O png --sample_ids LQMM2 --debug -b /work/aln_Plant.sortedRG1.bam > samplot_commands.sh
conda deactivate
And, there was no luck. Please see the attached log file. Any suggestion? SMPlot3_Log_Short.txt
Well, it looks like multiple filters are omitting variants.
- You have a large number of what appear to be small/single-ended BNDs and insertions, neither of which is supported by samplot. I wouldn't try too hard to recover these because even if you plot them, samplot images won't be very informative
- The call rate appears to be low for all variants. You could try troubleshooting the call rate in the VCF or modify the samplot cut off with
--min_call_rate. Another option is updating to the very newest release from just a few days ago (1.3.0, available on conda) and trying out the new--plot_alloption
Hey have you been able to sort this issue out? I am having the exact same problem.