Make plot res dynamic
Currently, plot width and height can be changed dynamically (e.g. with sliders), but plot resolution can't. This PR addresses that by given resolution the same treatment as width and height.
Thank you for your submission! We really appreciate it. Like many open source projects, we ask that you sign our Contributor License Agreement before we can accept your contribution.
You have signed the CLA already but the status is still pending? Let us recheck it.
Hopefully, 2 pictures are worth 1,000 words:
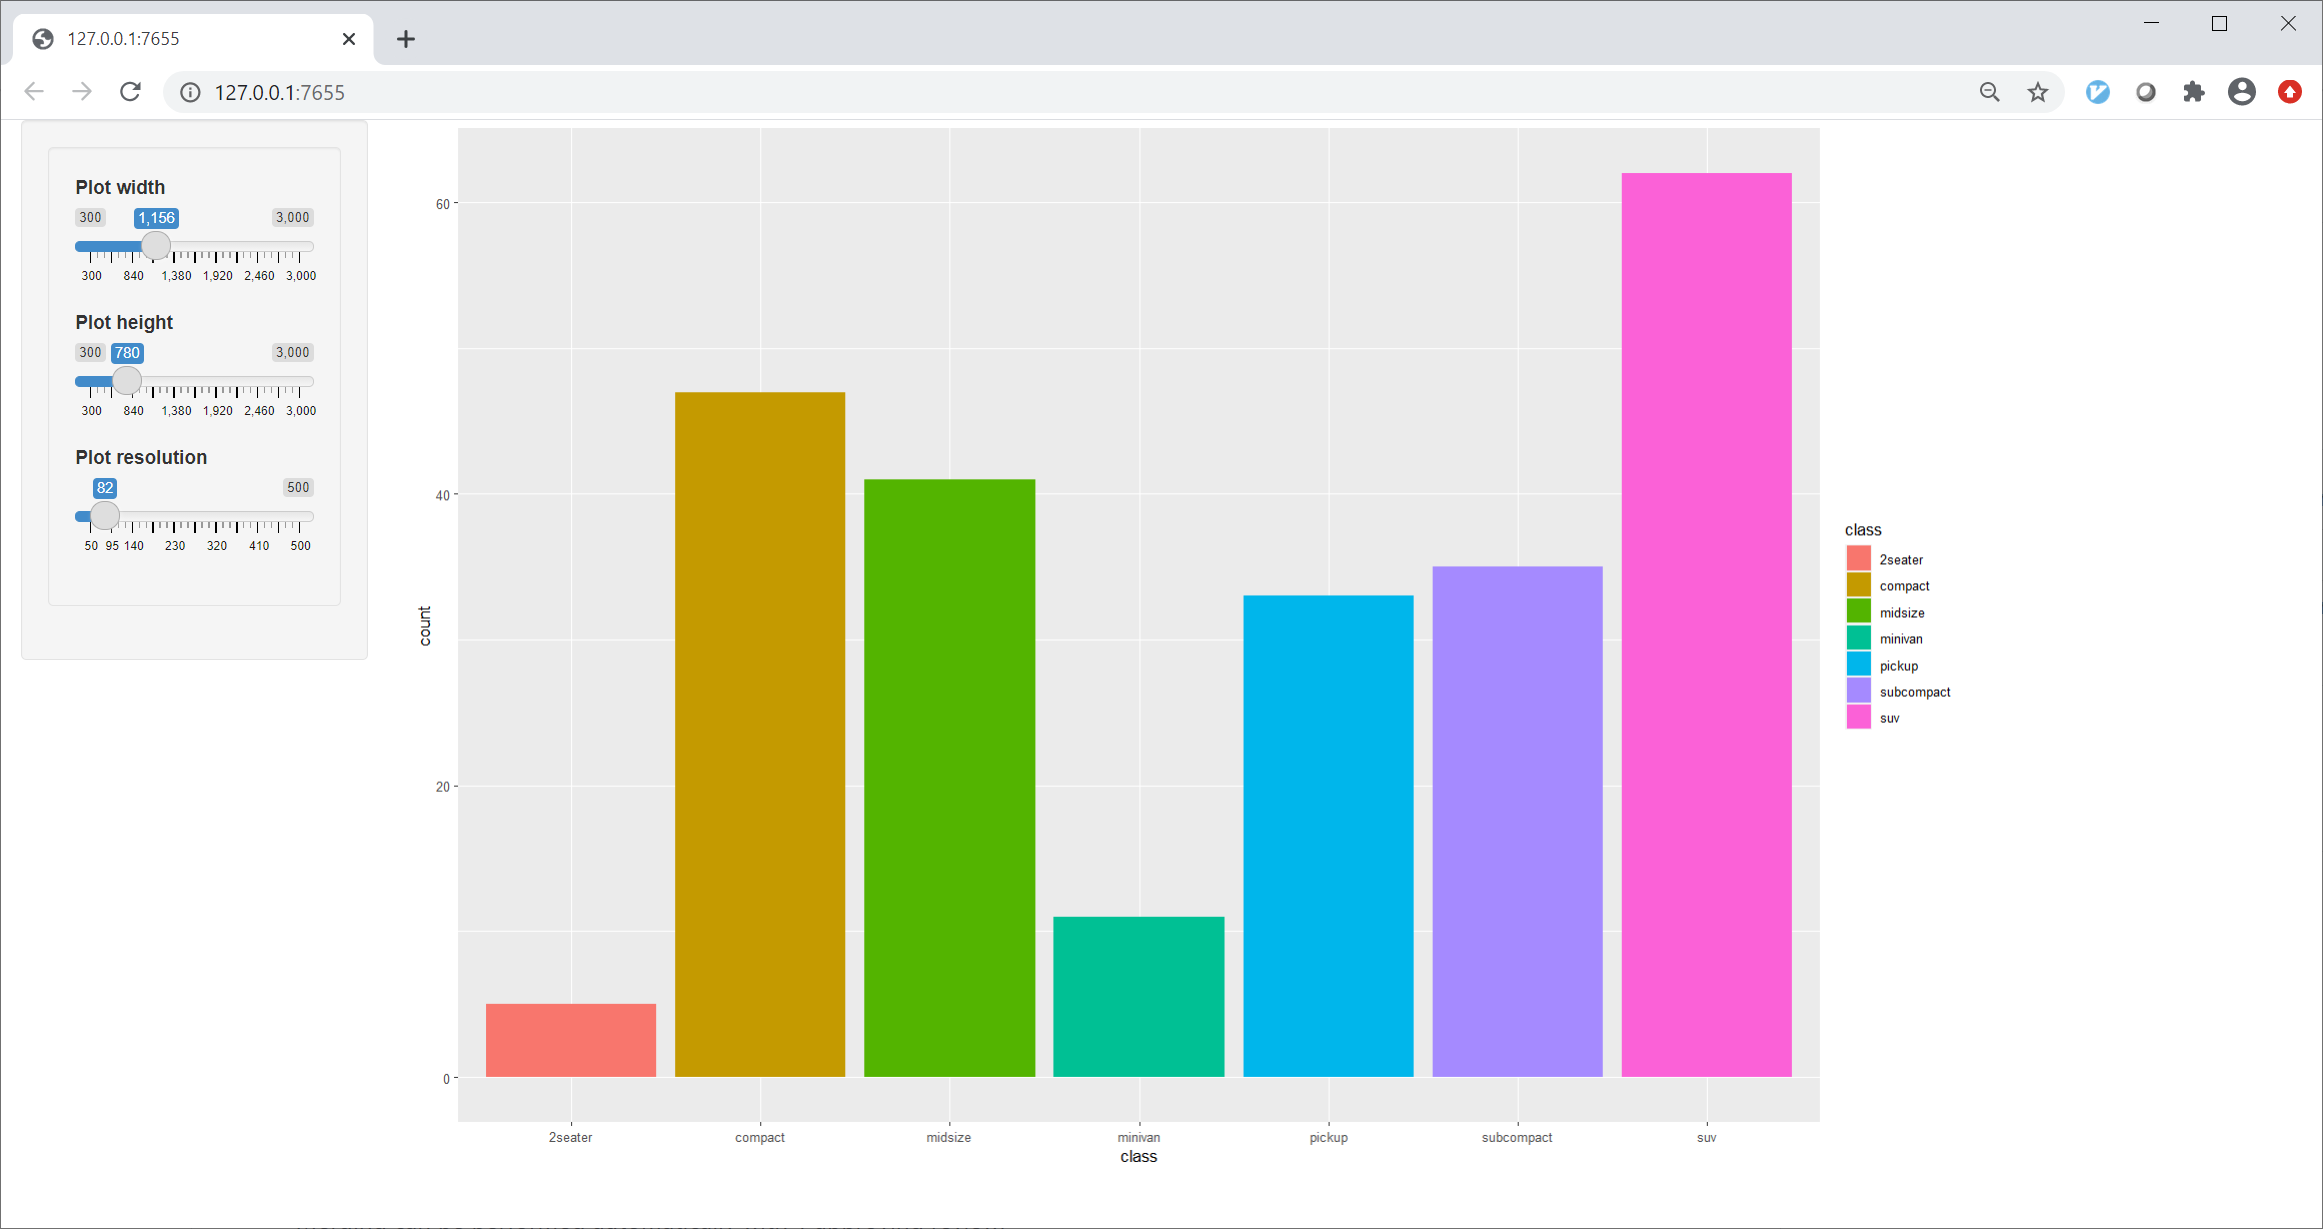
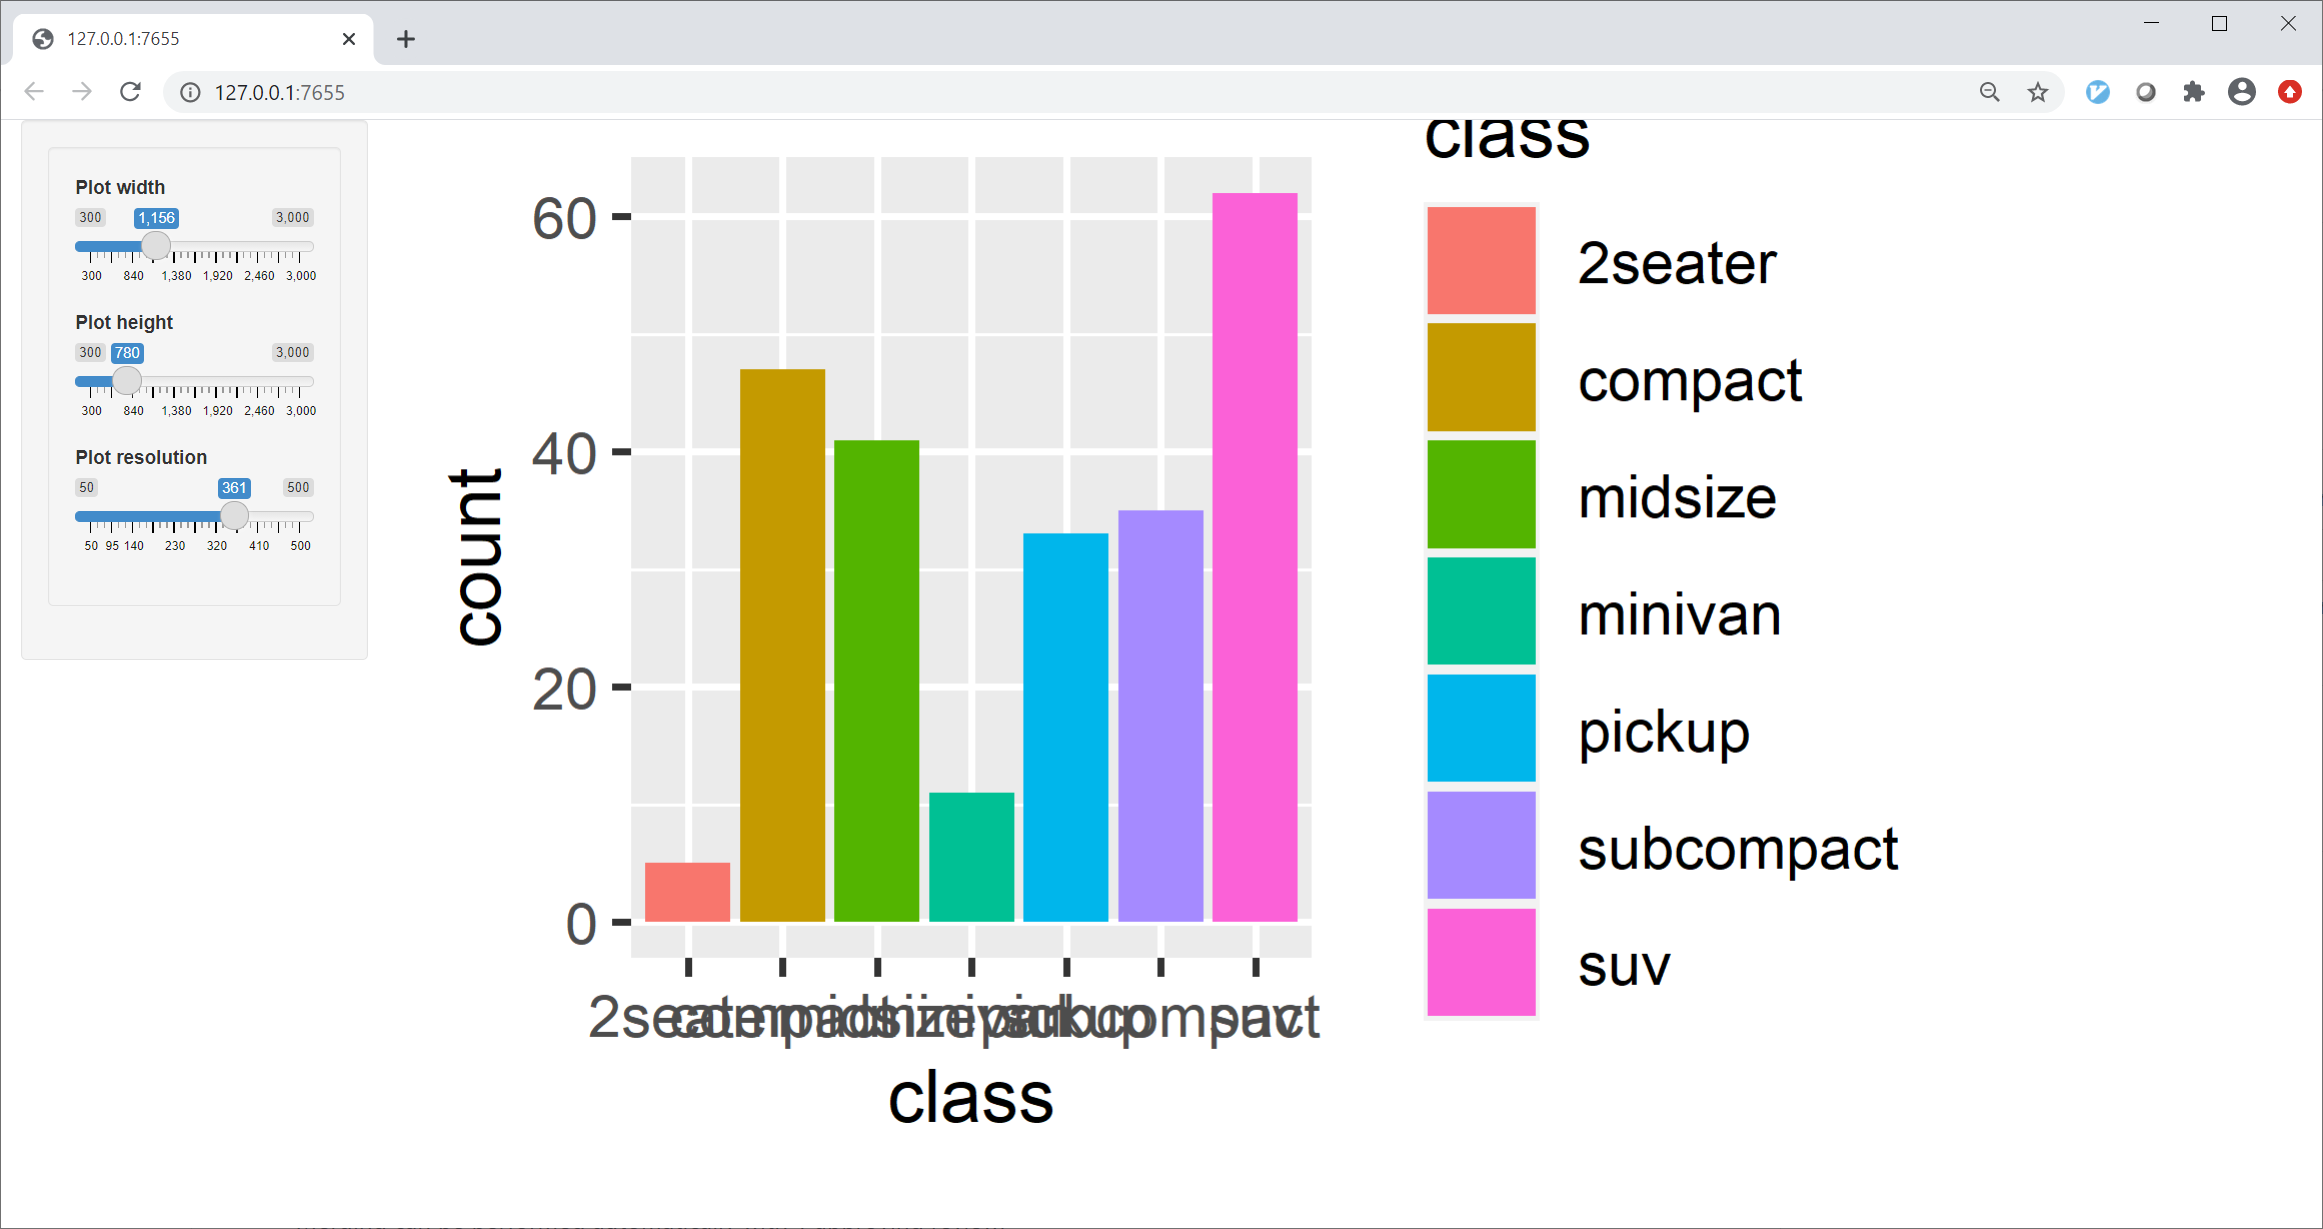
Changing the resolution changes the figure in a substantial way (e.g. size of the fonts).
Here's the code:
library(shiny)
library(ggplot2)


shinyApp(
  ui = fluidPage(
    sidebarLayout(
      sidebarPanel(width=2,
        wellPanel(
          sliderInput("plotwidth", "Plot width", value=1600, min=300, max=3000),
          sliderInput("plotheight", "Plot height", value=850, min=300, max=3000),
          sliderInput("plotres", "Plot resolution", value=200, min=50, max=500))),
      mainPanel(
        plotOutput("plot", width="auto", height="auto")))),

  server = function(input, output, session) {

    output$plot <- renderPlot(
      width=function() input$plotwidth,
      height=function() input$plotheight,
      res=function() input$plotres,
      {
      ggplot(mpg, aes(class, fill=class)) + geom_bar()
    })

  }
)
Right, I get what the effect is of changing res dynamically -- what I meant was, is there a practical use case you have in mind where you want to change it dynamically?
Right, sorry. So, I have an app where the user can make changes to an arbitrary plot (in this case I'm letting the user pass a ggplot object into the app using a global variable). Depending one how many elements (text labels and so on) the plot contains, it might look better at a lower or higher resolution. Hence the desire to be able to change the resolution as well as the size, since I don't know in advance what the appropriate resolution will be. Does that sound reasonable?
EDIT: Mainly, I want the text labels to be readable, and not overlap each other.
Mainly, I want the text labels to be readable, and not overlap each other.
Sounds like your issues would be better handled at the ggplot2 level (not the graphics device level) by doing something like theme_set(theme_gray(base_size = 16)) (and have a slider to control the base_size, not the resolution)
Not really, in my opinion, for the following reasons:
-
It doesn't have the same effect. If the plot is simple (e.g. a simple boxplot) it will look better at high res, and if it's complex (e.g. lots of facets) it will look better at low res, assuming they take up the same amount of space. Changing the
base_sizeisn't the solution. -
I can't change the ggplot theme in the app, because I don't know what theme the user wants, and I would like to avoid imposing on the user to have to change the theme outside of the app (they will be constructing the plot for a different purpose and using the app to simply try different colors, but should not be required to make changes the their code to accommodate the app).