NewRelic Tracing + Dataloader makes for slow queries
Describe the bug
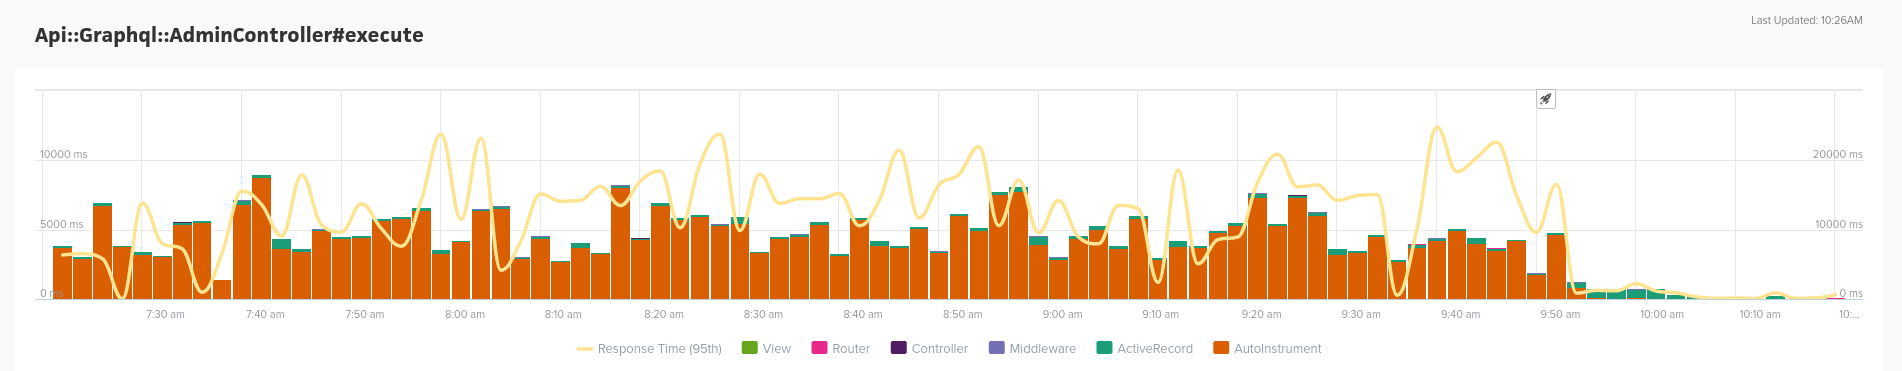
Yesterday we started using Dataloader to batch queries, and to our surprise, it made our GraphQL endpoint significantly slower. Here's the Scout chart:

The individual traces are not very helpful as they just indicate that a single code line (the query execution in the controller) takes most of the time.
This went against all my local benchmarks, so I knew it had something to do with a production config. We're moving away from NewRelic to Scout, but we still have NewRelicTracing enabled, and we don't use ScoutTracing.
After disabling NewRelicTracing, response times plummeted:
I don't know if this is specific to NewRelicTracing or PlatformTracing in general.
Versions
graphql version: 1.13.1
rails : 6.1.4.6
newrelic_rpm: 8.4.0
GraphQL schema
Here's the schema before removing the tracer:
class AdminSchema < GraphQL::Schema
  INTROSPECTION_QUERY_DEPTH = 13

  use(GraphQL::Tracing::NewRelicTracing)

  query_analyzer QueryLogger

  mutation(Types::Mutation)
  query(Types::AdminQuery)

  use GraphQL::Dataloader

  default_max_page_size 100
  max_depth 10

  rescue_from ActiveRecord::RecordNotFound do |exception|
    raise GraphQL::ExecutionError.new("Resource not found.", options: { type: "NOT_FOUND" })
  end

  rescue_from StandardError do |exception|
    if Rails.env.production? && !exception.is_a?(GraphQL::ExecutionError)
      Rollbar.error(exception)
      GraphQL::ExecutionError.new("Unknown error occurred. Please try again later.", options: { type: "INTERNAL_SERVER_ERROR" })
    else
      raise exception
    end
  end
end
My dataloader sources:
class Sources::ActiveRecord < GraphQL::Dataloader::Source
  def initialize(model_class)
    @model_class = model_class
  end

  # The resulting *array* must be of the same length and order as `ids`,
  # so we set missing objects to `nil`.
  def fetch(ids)
    @model_class.where(id: ids).index_by(&:id).values_at(*ids)
  end
end

class Sources::ActiveRecordAssociation < GraphQL::Dataloader::Source
  def initialize(model_class, association_name)
    @model_class = model_class
    @association_name = association_name

    if !@model_class.reflect_on_association(@association_name)
      raise ArgumentError, "No association #{@association_name} on #{@model_class}"
    end
  end

  def load(record)
    raise TypeError, "#{@model_class} loader can't load association for #{record.class}" unless record.is_a?(@model_class)

    super
  end

  def fetch(records)
    ::ActiveRecord::Associations::Preloader.new.preload(records, @association_name)

    records.map { |record| read_association(record) }
  end

  private

  def read_association(record)
    record.public_send(@association_name)
  end
end
The objects involved in the query
class Types::AdminQuery < Types::BaseObject
  graphql_name "Query"
  description "The query root of this schema."

  field :members, Types::Member.connection_type, "A list of all members.", null: true

  def members
    context[:current_site].members.order(:id)
  end
end

class Types::Member < Types::BaseObject
  graphql_name "Member"

  field :orders, [Types::Order, null: true], "A list of all orders for this member.", null: true
  field :subscriptions, [Types::SubscriptionType], "A list of all subscriptions for this member.", null: false

  def orders
    dataloader.with(Sources::ActiveRecordAssociation, Member, :orders).load(object)
  end

  def subscriptions
    dataloader.with(Sources::ActiveRecordAssociation, Member, :subscriptions).load(object)
  end
end

class Types::SubscriptionType < Types::BaseObject
  graphql_name "Subscription"

  field :plan, Types::Plan, "The plan this subscription is associated with.", null: true

  def plan
    dataloader.with(Sources::ActiveRecord, Plan).load(object.plan_id)
  end
end
GraphQL query
{
  members(last: 100) {
    nodes {
      fullName
      email
      subscriptions {
      	expiresAt
        active
        plan {
          name
        }
      }
      orders {
        uuid
        totalCents
        purchasableType
      }
    }
  }
}
Expected behavior
I expected the Dataloader to significantly reduce query execution time
Actual behavior
Instead, it made things worse.
Additional context
My uneducated guess is that the tracer is going crazy with all the batching going on, but I'm not too familiar with the gem internals to understand why.
Because we're moving away from NewRelic, we don't have any plans of bringing back the tracer, so this is more of a heads-up kind of issue.
I can open an issue in the NewRelic gem if you think this is related to their internal tracing and not the GraphQL tracer
Woah! Thanks for the details on this. I definitely want to take a close look at this -- how terrible 😖 I never ran profiles on the dataloader with a tracer installed... I wonder why it's so much worse!
Locally, I updated some existing benchmarks to use the NewRelicTracing. The slowdown was visible -- 20% -- but not astronomical:
  Calculating -------------------------------------
  Querying for 1000 objects
-                           4.842  (± 0.0%) i/s -     25.000  in   5.164193s
+                           4.124  (± 0.0%) i/s -     21.000  in   5.121483s
Memory-wise, adding tracing had almost no impact on graphql-ruby (+0.01%) but newrelic added ~8% more objects -- understandable.
But, my example didn't use ActiveRecord -- maybe getting that in the mix would demonstrate the bug. I'll take another look at that soon.
Diff for benchmarks:
 $ git diff
diff --git a/Gemfile b/Gemfile
index ca97504ac..2fe882480 100644
--- a/Gemfile
+++ b/Gemfile
@@ -20,3 +20,5 @@ group :jekyll_plugins do
   gem 'jekyll-algolia', '~> 1.0'
   gem 'jekyll-redirect-from'
 end
+
+gem "newrelic_rpm", "~> 8.4"
diff --git a/benchmark/run.rb b/benchmark/run.rb
index f67acc3f8..6e4e845a2 100644
--- a/benchmark/run.rb
+++ b/benchmark/run.rb
@@ -5,6 +5,7 @@ require "benchmark/ips"
 require "stackprof"
 require "memory_profiler"
 require "graphql/batch"
+require "newrelic_rpm"

 module GraphQLBenchmark
   QUERY_STRING = GraphQL::Introspection::INTROSPECTION_QUERY
@@ -134,6 +135,7 @@ module GraphQLBenchmark

     class Schema < GraphQL::Schema
       query QueryType
+      use GraphQL::Tracing::NewRelicTracing
       use GraphQL::Dataloader
     end
Chiming in to add that I have been using Dataloader to try to improve a slow query from ~2.5s, and adding New Relic tracing to try to diagnose further slowed it down to 15s (!!). Removing New Relic tracing resolved that, so now I'm back to 2.5s but with less visibility. Though, FWIW, I also think New Relic's tracing on the dataloader was useless -- it seemed to be reporting very long runtimes for resolving fields that used the dataloader. Probably because it tracked wall clock time or something from start of field resolution until the end, which was indeed slow but not because of the code itself.
Same here. In my case, 1.2s w/ NewRelicTracing enabled vs 270ms w/o NewRelicTracing.
We are seeing this issue too. Enabling NewRelicTracing causes us to hit the Heroku timeout of 30 seconds.
Sorry for the trouble on this :S If anyone can replicate the issue in development, it'd be great to get a local profile of a slow query, with stackprof or memory_profiler. I'm just not sure where to look 😖
Hi, I succeeded to create an example that causes 446ms -> 33670ms slowness on my laptop. It's nice if you kindly take time to check it 😄 https://github.com/hkdnet/graphql-ruby-nr
After some investigation, I found NewRelic::Agent::RangeExtensions.merge_or_append consumes time.
You can see a flamegraph with this branch. https://github.com/hkdnet/graphql-ruby-nr/tree/stackprof

^ is a zoomed capture. The pink rectangle is merge_or_append.
I confirmed 33670ms -> 700ms speed-up if merge_or_append doesn't consume time (though this patch breaks newrelic_rpm completely). This shows merge_or_append is the main cause.
https://github.com/hkdnet/newrelic-ruby-agent/commit/3c097d601be6b935ca9dcd646ffe7a210f73a9bb
DataLoader creates a lot of descendant ranges and merge_or_append is called every time a descendant finishes (NewRelic::Agent::Transaction::AbstractSegment#descendant_complete)
I think the right way is to speed up newrelic_rpm gem.
I'd like to know if you have any workaround ideas 😸
Great work @hkdnet, thanks for digging in and posting a repro! I logged https://github.com/newrelic/newrelic-ruby-agent/issues/1264 for the New Relic side
Hi all. Thanks very much to @bmulholland for letting us (New Relic) know about this issue. Thanks very much also to @hkdnet for determining that New Relic's merge_or_append method is the bottleneck!
We have investigated and prepped a potential fix.
The current hypothesis is that the graphql gem is invoking the New Relic Ruby agent gem's trace_execution_scoped method frequently over a short time period and the New Relic agent's internal system of keeping track of multiple potentially overlapping traces is not performant when there are that many (~100 or so) overlapping traces in play.
With https://github.com/newrelic/newrelic-ruby-agent/pull/1274 we have completely removed the merge_or_append method and reworked its original caller to be more performant when dealing with a big batch of traces.
We would love some help with testing out the new branch to see if it helps with performance. If it does, we can include the changes in a future agent release.
There is a new strider branch of the project that is ready for testing.
A Ruby project's Gemfile can be set to use the strider branch of the New Relic Ruby agent like so:
gem 'newrelic_rpm', git: 'https://github.com/newrelic/newrelic-ruby-agent', branch: 'strider'
The graphql gem is used (and loved!) inside New Relic as well, but we haven't been using dataloader.
If there are any questions or feedback for us, we'll keep an eye on this GitHub Issue as well as the https://github.com/newrelic/newrelic-ruby-agent/issues/1264 twin over in our repo.
Thanks for your investigation and fix on this, @fallwith! If anyone runs into trouble like this after updating to 8.10.0, please open a new issue to discuss it.
To keep everyone in the loop: performance is indeed better, but not good enough. When I enable use GraphQL::Tracing::NewRelicTracing, set_transaction_name: true in production, a key GraphQL query goes from 1-2s to 6-7s. I've filed https://github.com/newrelic/newrelic-ruby-agent/issues/1345 for that.
The New Relic Ruby agent team has made further improvements to the performance of segment completion. These improvements brought an internal user's service running GraphQL Dataloader from a > 5 seconds delay to a < 15 ms delay. We have confidence Dataloader and New Relic can peacefully coexist in versions 9.2.2+ of newrelic_rpm.