Matrix broadcast processing times show long-tailed distribution
Problem Definition
We experienced some failing scenarios due to missing or slow broadcast messages (#6723, #6756, #2483).
Investigation on the production transport servers showed http request times for the broadcast endpoint
PUT /rooms/$room_id/send/m.room.message > 10 seconds.
Synapse's generic_worker log internal processing times for requests
https://github.com/matrix-org/synapse/blob/a7a913918cf04c6d900223b19e719fafbbe94efa/synapse/http/site.py#L311-L322
Here is an excerpt (05-01-2020 20:00:00 - 05-01-2020 21:59:99 on transport01.raiden.network)
of how the times are distributed:
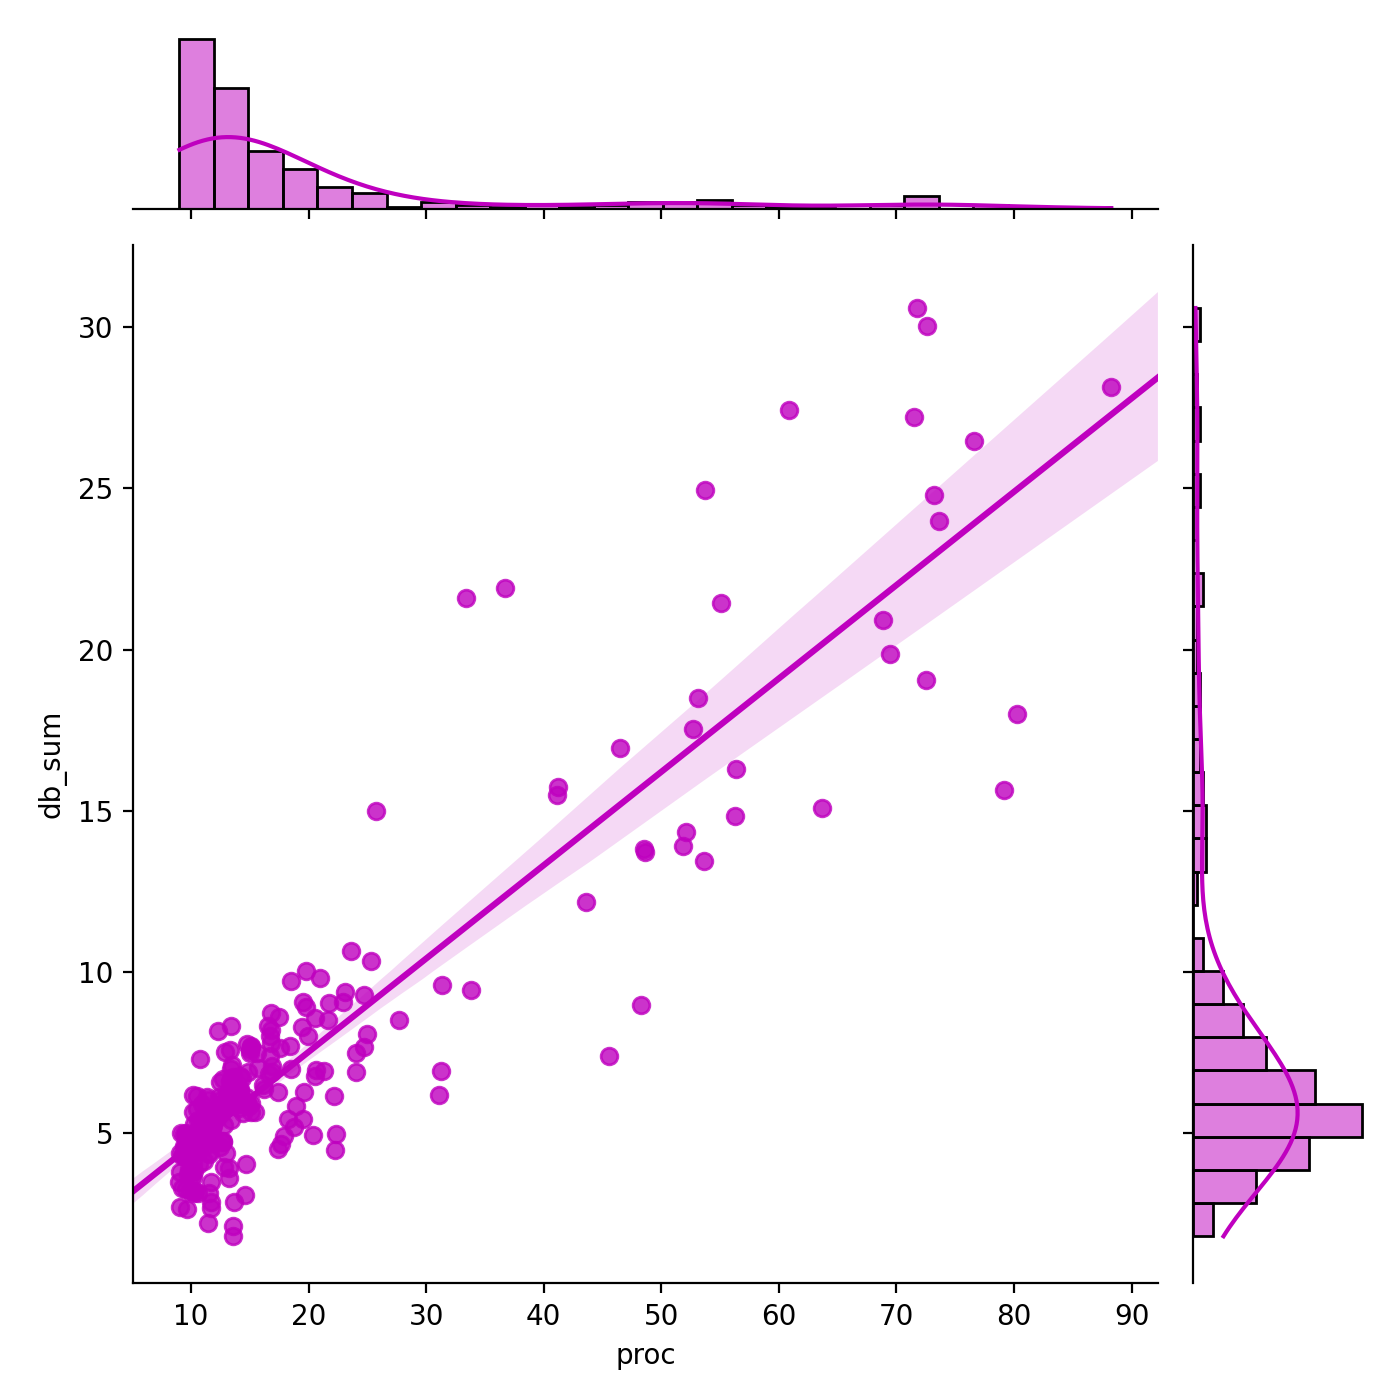
x-Axis corresponds to the processing time in the logging context, while the y-Axis corresponds to the sum of the database-processing time and the time waiting for a database connection.
All samples are filtered for the aforementioned broadcast endpoint, and are only plotted if proc > 9s
Keep in mind, that the processing finishes when the client disconnects, so those times are possibly shorter than they would be for a successful lifecycle.