Wrapping polygons around dateline while respecting spherical geometry
Good day all. I have multiple sets of four points (forming MULTIPOINT geometry), from which I would like to create a convex hull polygon. A number of these sets of four points are split across the dateline. When using the st_wrap_dateline() method, an issue I encounter is that the wrap seems to be done at the rhumb edge line, and not following spherical geometry.
Example data:
library(sf)
library(tidyverse)

boundPt = tibble(geom = "MULTIPOINT ((-155.6272 83.59645), (-158.4624 82.76645), (170.6628 83.13731), (169.2196 84.01812))") %>%
  st_as_sf(wkt = "geom", crs = 4326)

boundPoly = boundPt %>%
  st_convex_hull() %>%
  st_wrap_dateline(options = c("WRAPDATELINE=YES", "DATELINEOFFSET=180"))
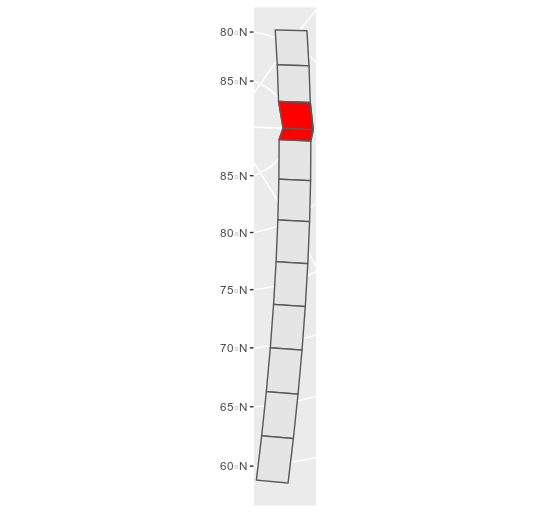
Here is the output (example polygon in red, others polygons that do not cross the antimeridian in gray for context and representation of the intended behavior, can also provide them if needed).
library(ggplot2)

ggplot() +
  geom_sf(data = otherPoly) +
  geom_sf(data = boundPoly, fill = "red") +
  coord_sf(crs = "+proj=ortho +lat_0=60 +lon_0=90")
Tried to play around with st_use_s2 FALSE and TRUE, without any effect. Do you have any guidance as to how achieve the intended result? Thank you.
st_convex_hull() doesn't support spherical geometry, it won't take care of the dateline wrapping by itself.
Thank you for the heads up. What approach would you recommend to keep spherical geometry? Casting my multipoint geometry to polygon and then dateline wrapping also seems to give the same result.
boundPoly = boundPt %>%
  st_cast(to = "POLYGON") %>%
  st_wrap_dateline(options = c("WRAPDATELINE=YES", "DATELINEOFFSET=180"))

ggplot() +
  geom_sf(data = boundPoly, fill = "red") +
  coord_sf(crs = "+proj=ortho +lat_0=60 +lon_0=90")
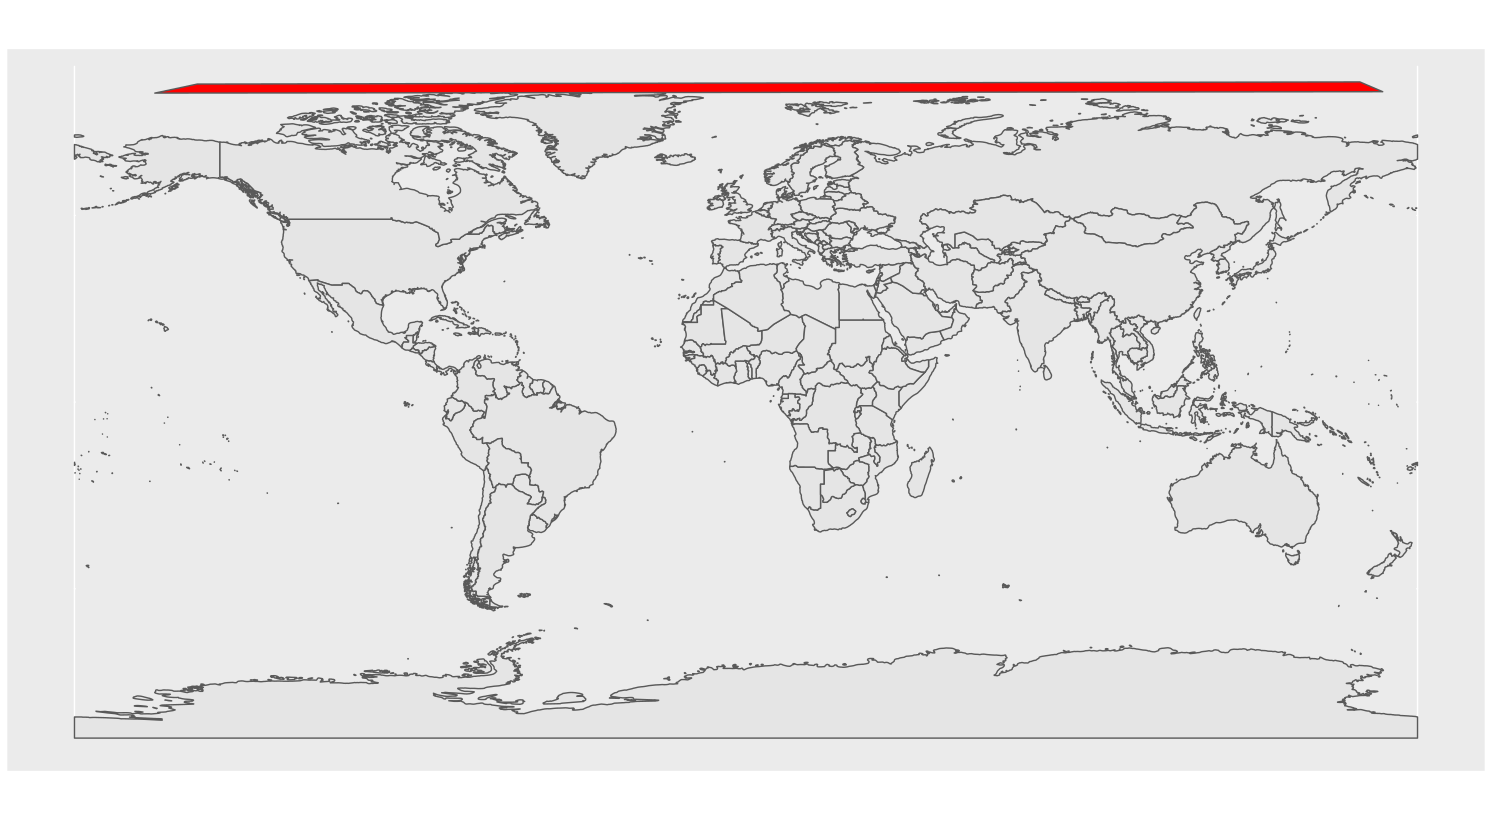
For the area involved: add 180 to latitude, do convex hull, subtract 180. st_shift_longitude()?
I would need to split at dateline either way, as the full set of geometry is global and I would need them in +/-180 bounds.
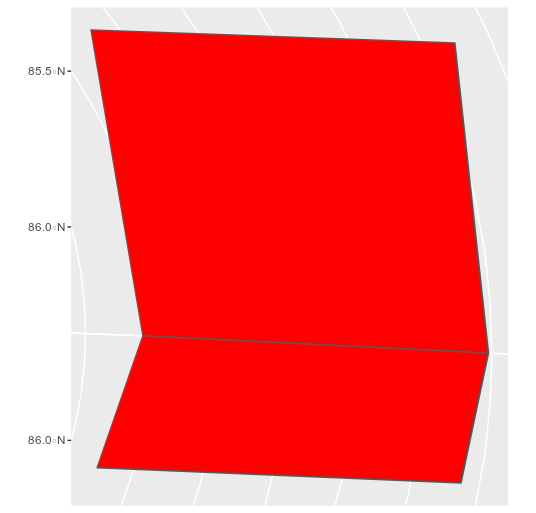
st_shift_longitude() then subtracting 180 would give this:
Whereas I am eventually looking at something like this, but with the dateline split following the spherical edge and not the rhumb edge.

(reason for the +/-180 bounds requirement is that the full data is distributed globally, and I am eventually looking to rasterize the polygons in EPSG:4326)
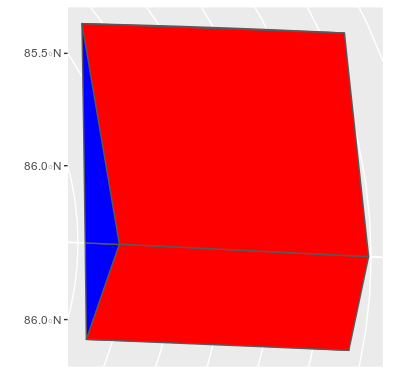
Tested a workaround which seems to work nicely, using st_shift_longitude() then st_segmentize(), the latter calling lwgeom::st_geod_segmentize() which works along the great circle in lon/lat CRS.
A last question before closing - is it possible to have clarification on the unit used by the dfMaxLength argument in st_segmentize()? I am not sure how to interpret the documentation of the called lwgeom::st_geod_segmentize()': "segment length in degree, radians, or as a length unit (e.g., m)".
How to specify which unit is used? In the following example, I seem have to set quite a high value to avoid getting a too high number of segments. Is that in meters?
boundPt = tibble(geom = "MULTIPOINT ((-147.0928 85.18586), (-158.4624 82.76645), (170.6628 83.13731), (164.5494 85.76135))") %>%
  st_as_sf(wkt = "geom", crs = 4326) %>%
  st_shift_longitude() %>%
  st_cast(to = "POLYGON") %>%
  st_segmentize(dfMaxLength = 40000) %>%
  st_wrap_dateline(options = c("WRAPDATELINE=YES", "DATELINEOFFSET=180"))

boundPt2 = tibble(geom = "MULTIPOINT ((-147.0928 85.18586), (-158.4624 82.76645), (170.6628 83.13731), (164.5494 85.76135))") %>%
  st_as_sf(wkt = "geom", crs = 4326) %>%
  st_shift_longitude() %>%
  st_cast(to = "POLYGON") %>%
  st_wrap_dateline(options = c("WRAPDATELINE=YES", "DATELINEOFFSET=180"))

ggplot() +
  geom_sf(data = boundPt, fill = "blue") +
  geom_sf(data = boundPt2, fill = "red") +
  coord_sf(crs = "+proj=ortho +lat_0=60 +lon_0=90")