pyfolio

pyfolio copied to clipboard
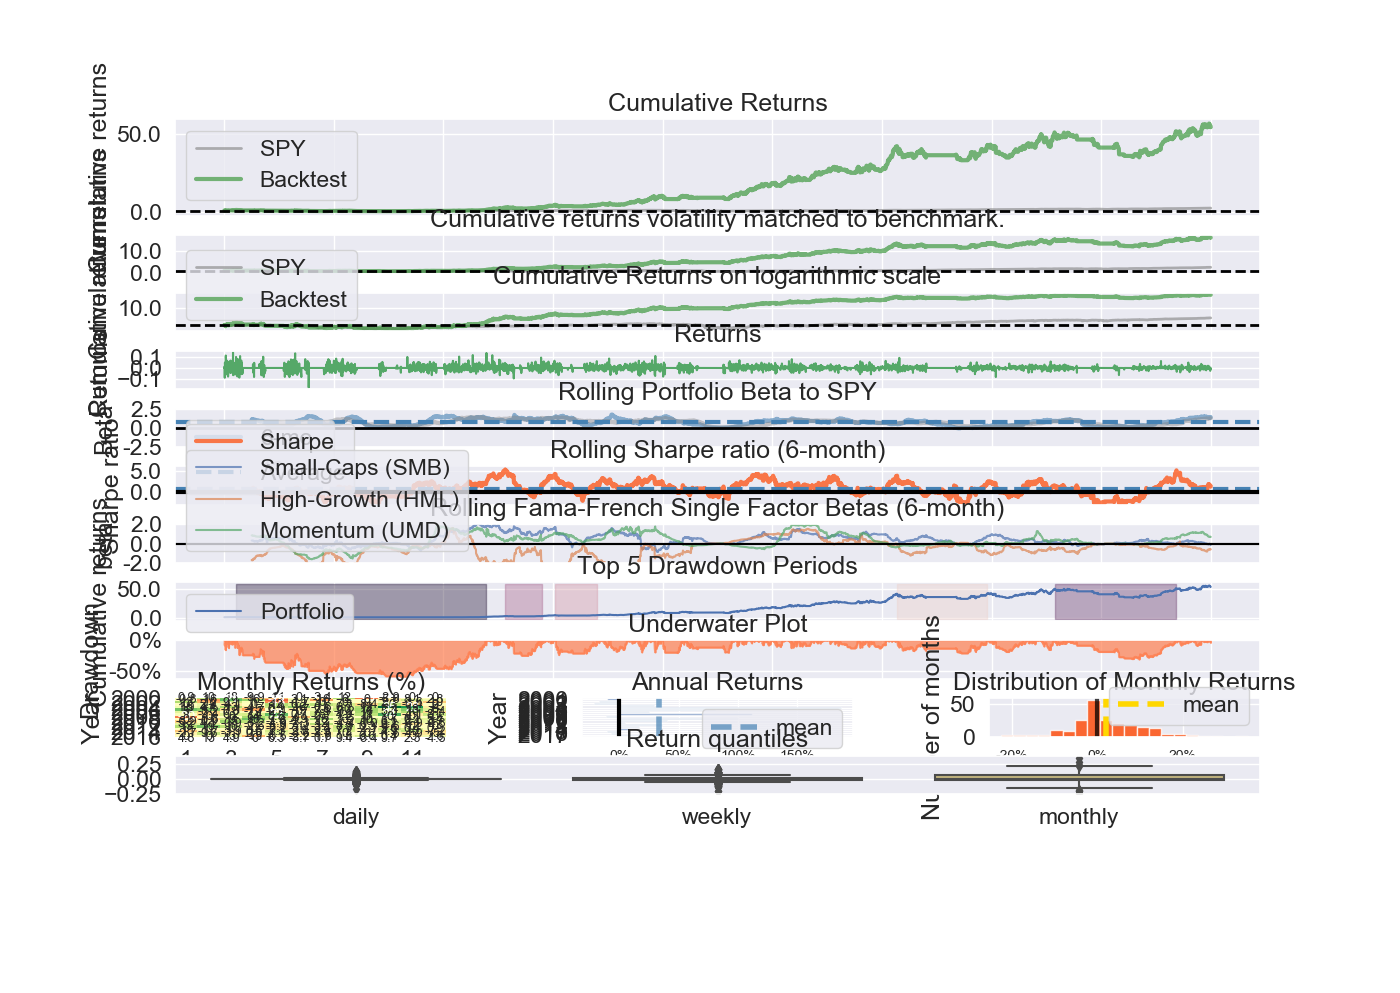
All plotting charts in 1 big figure by create_returns_tear_sheet
Problem Description
All plotting charts in 1 big figure by create_returns_tear_sheet
Please provide a minimal, self-contained, and reproducible example:
from zipline import run_algorithm
from zipline.api import order_target_percent, symbol, set_commission
from zipline.finance.commission import PerTrade
import pandas as pd
import pyfolio as pf

import warnings
warnings.filterwarnings('ignore')

def initialize(context):
    context.stock = symbol('AAPL')
    context.rolling_window = 90
    set_commission(PerTrade(cost=5))


def handle_data(context, data):
    price_hist = data.history(context.stock, "close", context.rolling_window, "1d")
    order_target_percent(context.stock, 1.0 if price_hist[-1] > price_hist.mean() else 0.0)

def analyze(context, perf):
    returns, positions, transactions = pf.utils.extract_rets_pos_txn_from_zipline(perf)
    pf.create_returns_tear_sheet(returns, benchmark_rets = None)

start_date = pd.to_datetime('2000-1-1', utc=True)
end_date = pd.to_datetime('2018-1-1', utc=True)

results = run_algorithm(start = start_date, end = end_date, initialize = initialize, analyze = analyze, handle_data = handle_data, capital_base = 10000, data_frequency = 'daily', bundle ='quandl')
Please provide the full traceback:
see attached
Please provide any additional information below:
Versions
- Pyfolio version: 0.5.1
- Python version: 3.6.5
- Pandas version: 0.22.0
- Matplotlib version: 3.1.1