Feature request: 7 day reporting period
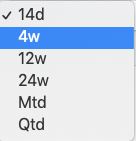
For many of the dashboard stats, we can get reports on fixed durations like 14 days:
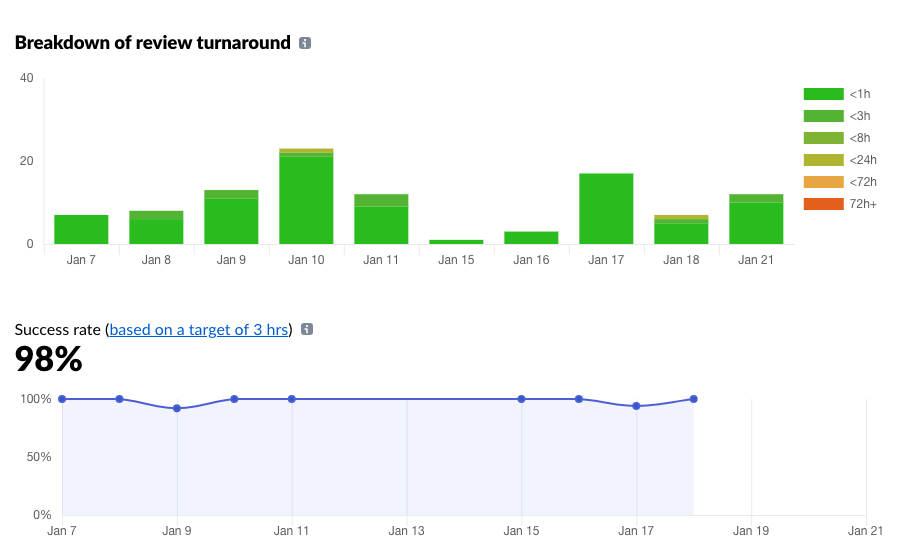
We have a weekly debrief currently to look at these stats, and although I can get a sense of things visually, e.g. review turnaround:
The high level numbers, like %age meeting target are based on minimum 14 days. It'd be great if I could get these weekly (so 7 day duration would be a great number for us - or perhaps for more flexibility, even better arbitrary date range selection) so that we can more easily identify stats on a week by week basis without things being skewed from the week before the one we are assessing.
@davidgoate Makes sense. Adding this to the backlog. Please nudge this in a bit if we haven't gotten to it and it's still bugging you.
@davidgoate Question for you – which visuals/charts/tables are you focusing on in your weekly debriefs?
@abinoda we look at a few things including;
- Review turnaround success rate and chart, we then look at the PR's that exceeded target - especially interested in whether many of these are happening either in the same repos or in the same team. It would be quite handy to get stats per repo or per github "team" to identify "hotspot" projects for e.g. sometimes i do this manually a bit by making notes and changing filters by team.
- Time to merge average and chart and again which PR's exceeded, which repos are they in, which teams etc .
- Throughput, identifying trends and looking at the difference between opened and merged (trying to minimise).
- Success rate on PR size targets and trying to correlate (a bit manually) with review turnaround time and overall time to merge PR.
- LOC change per team over reporting period
(we also focus on things that are not from pull reminders, like number of deployments, jira points completed, difference in number between staging deploys and production deploys etc).
On a separate note, it'd be quite nice to get stats on how many times a PR enters review and what the rates are for how many times PR's are rejected, average number of reviews until approved. Helpful to see if some projects get more rejections than others on average or whether some reviewers or authors have higher rates or approvals/rejections.
@davidgoate Quick q – we were looking into this but realized you should be able to get each week's aggregate success rate by hovering over the chart with the 4w period selected. Right?
@abinoda I hadn't thought of that. I think that works well for getting the high level aggregate scores. One small usability enhancement though, using review turnaround as an example, if we are interested in the actual PR's which missed targets in a given week it's a little bit manual at that point to go through all the ones from a 4 week period (or switch back to 14 days to help) and then try to identify the ones from the relevant time period. Not a huge deal, but could be a bit better with an explicit 7 day filter or dat range picker. Thanks for the suggestion r.e. using the 4 week view, I think that will be a step forward.