Can not add hatch with bar plot.
Description
Can not add hatch with bar plot.
Steps to reproduce
import numpy as np
import proplot as pplt
pplt.rc['hatch.color'] = 'k'
fig, ax = pplt.subplots(refwidth=4, refheight=3)
ax.format(ylabel=f"degC/month",xlabel = 'Terms',grid=False,suptitle_kw = {"fontsize":12})
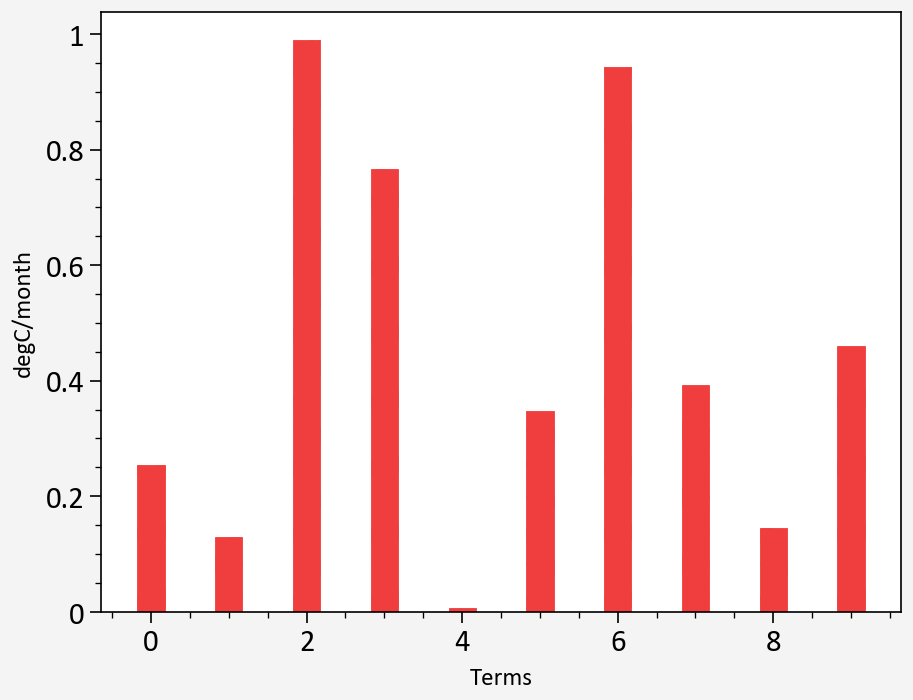
ax.bar(np.arange(10),np.random.rand(10),negpos=True,width = 0.35,hatch = '*')
Equivalent steps in matplotlib
A same way in matplotlib, which can show the stars
import matplotlib.pyplot as plt
fig = plt.figure(figsize=(4,3))
ax = fig.add_subplot(111)
ax.bar(np.arange(10),np.random.rand(10),width = 0.35,hatch = '*')

Proplot version
matplotlib:3.4.3 proplot:0.9.5
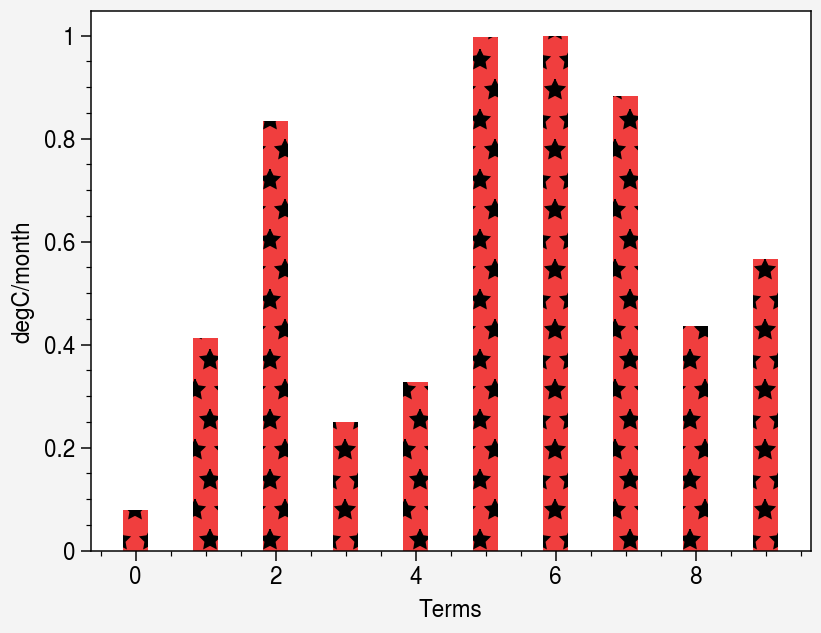
You can specify the edgecolor and hatch will take it automatically.
If you only want the hatch, you can set edgewidth=0.
import numpy as np
import proplot as pplt
pplt.rc['hatch.color'] = 'k'
fig, ax = pplt.subplots(refwidth=4, refheight=3)
ax.format(ylabel=f"degC/month",xlabel = 'Terms',grid=False,suptitle_kw = {"fontsize":12})
ax.bar(np.arange(10),np.random.rand(10),negpos=True,width = 0.35, edgecolor='k', hatch='*')
Thanks a lot. I will try it later. This is an amazing project by the way.
This seems to be fixed in the latest "dev" version (install with pip install git+https://github.com/proplot-dev/proplot). I believe I used to override the edgecolor in some way, but now I just revert to matplotlib's default behavior.
With your example:
import numpy as np
import proplot as pplt
pplt.rc['hatch.color'] = 'k'
fig, ax = pplt.subplots(refwidth=4, refheight=3)
ax.format(ylabel=f"degC/month",xlabel = 'Terms',grid=False,suptitle_kw = {"fontsize":12})
ax.bar(np.arange(10),np.random.rand(10),negpos=True,width = 0.35,hatch = '*')
v0.9.7 output:

dev version output: