Add debugger support to ND version
When you build the ND version again, you may also want to add this change to JsEngine.NativeMethods: https://github.com/dpwhittaker/Espresso/commit/53388e36705c8dc7d2dacc88b26c88c017644130#diff-5d67ff4aeda70590cede90599ce6f971
This allowed me to add --inspect as a node parameter and connect the chrome debugger to javascript in initial testing.
If there is another way to do this, let me know.
EARLY preview
see https://github.com/prepare/Espresso/commit/1436b5665553175120d7416c2ecda83f1531af8d
for latest pre-built binary (espr_nd) , on win64, VS2017
see https://github.com/prepare/espresso_release_tmp
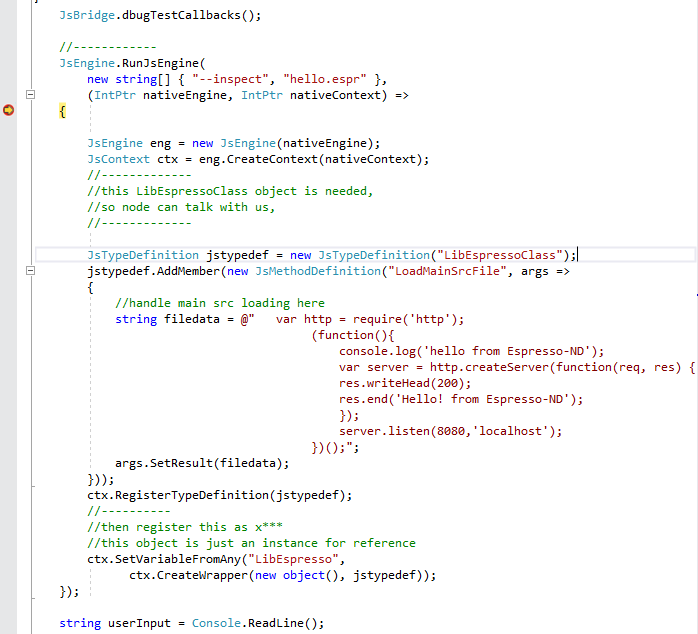
pic 1: add --inspect before our hello.espr module
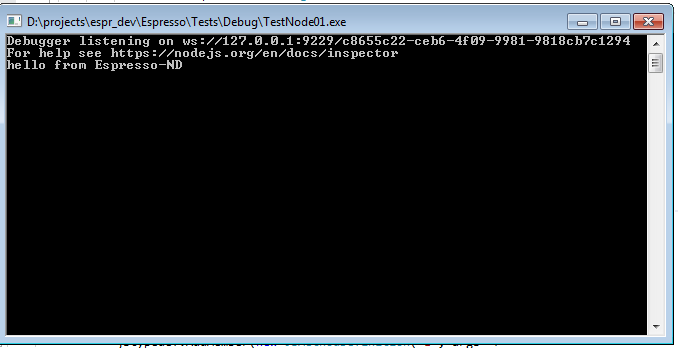
pic 2: epresso-nd starts with --inspect
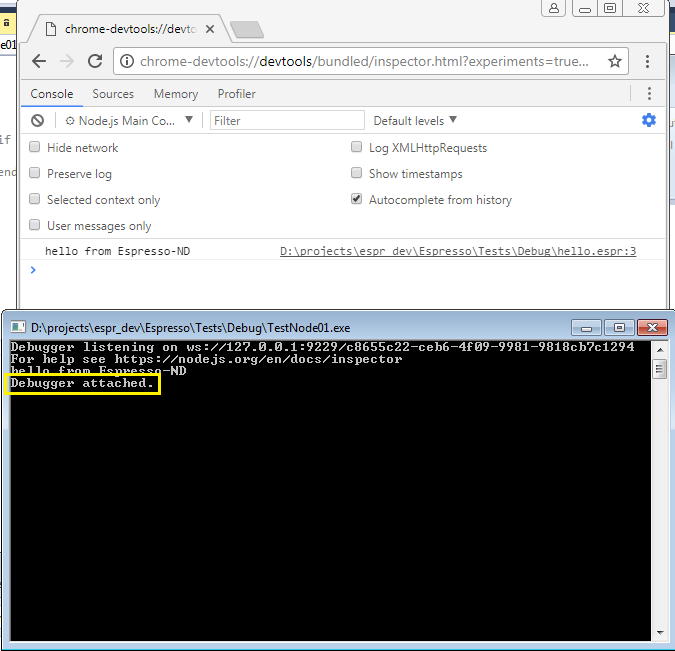
pic 3: debugger (chrome) attached
I plan to review original's node-inspector (js version) and figure out how to wrap it.
@prepare's note:
from https://chromedevtools.github.io/devtools-protocol/
... your application can discover available pages by requesting: http://localhost:9222/json and getting a JSON object with information about inspectable pages along with the WebSocket addresses that you could use in order to start instrumenting them. ...
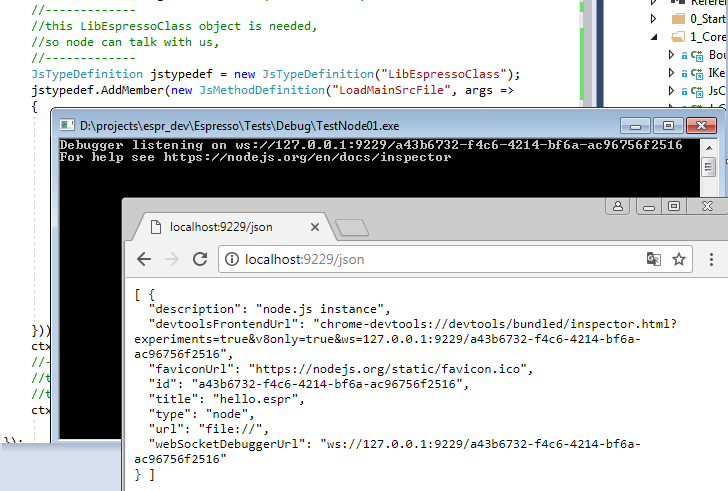 pic 1: with chrome , goto http://localhost:9222/json
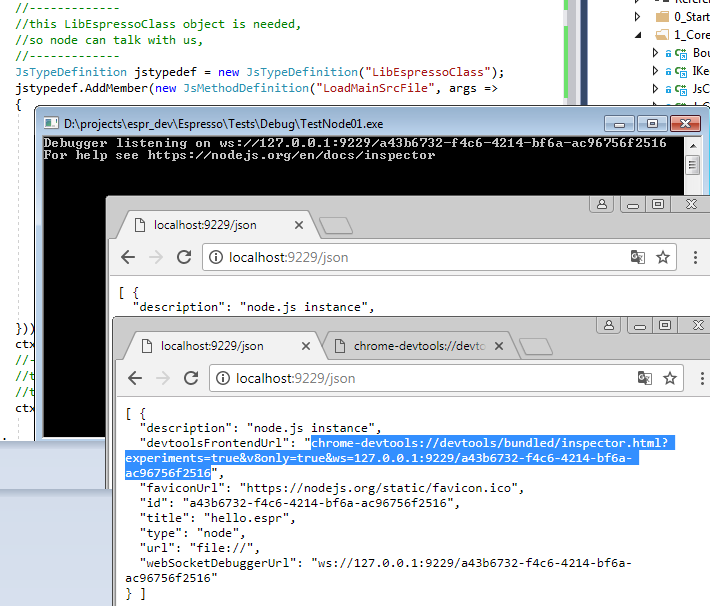 pic 2: get debug info, copy it
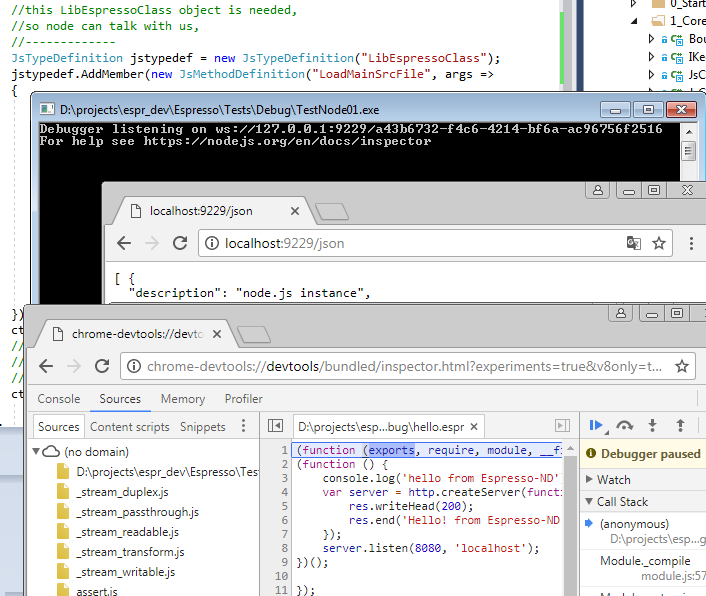 pic 3: paste to another page, the chrome debugger will attach the debug session
about debugger-protocol see: https://chromium.googlesource.com/v8/v8/+/master/src/inspector/js_protocol.json