grid.echo fails on 3D histogram with `graphical parameter "lwd" has the wrong length`
Hello,
I think I found another case where a graphical parameter is not properly captured. This time the problem occurs with 3D histograms.
Reproducible example:
library(plot3D)
library(gridGraphics)

pfun <- function() {
  hist3D(x = 1:5, y = 1:4, z = VADeaths,
         bty = "b2", phi = 20,  theta = -65,
         col = "#56B4E9", border = "gray30", shade = 0.2,
         space = .3, d = 2
  )
}
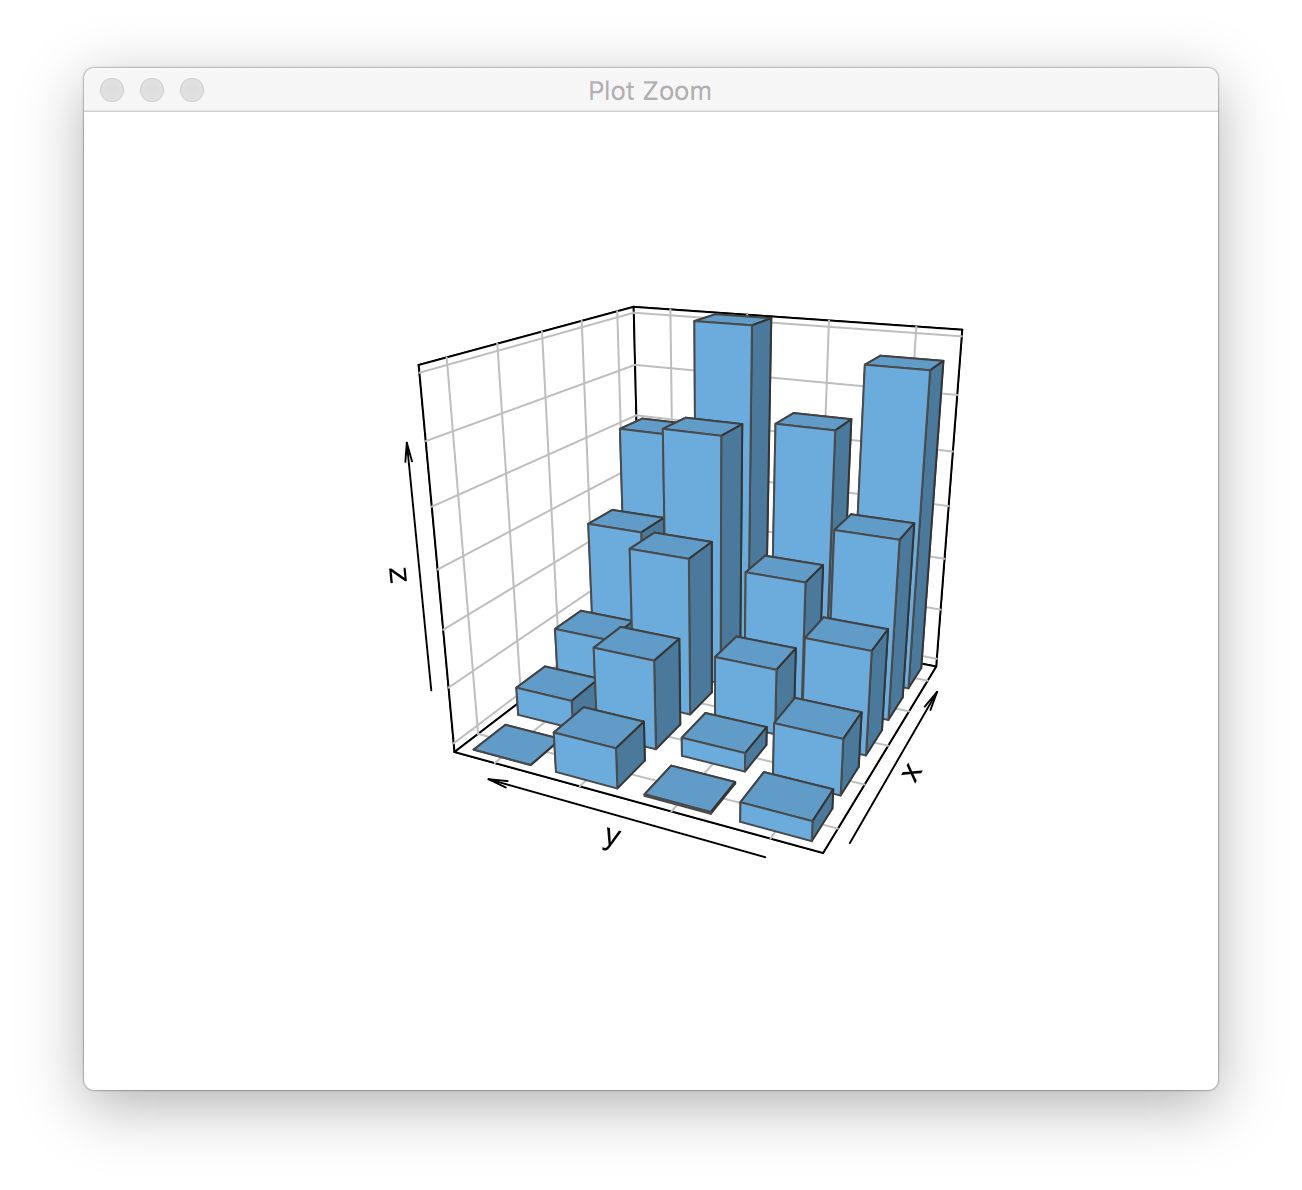
If we execute pfun(), we get the following result:
> pfun()
If we try to grid.echo() the same plot, we get the following:
> grid.echo(pfun)
Error in par(inlinePars) : graphical parameter "lwd" has the wrong length
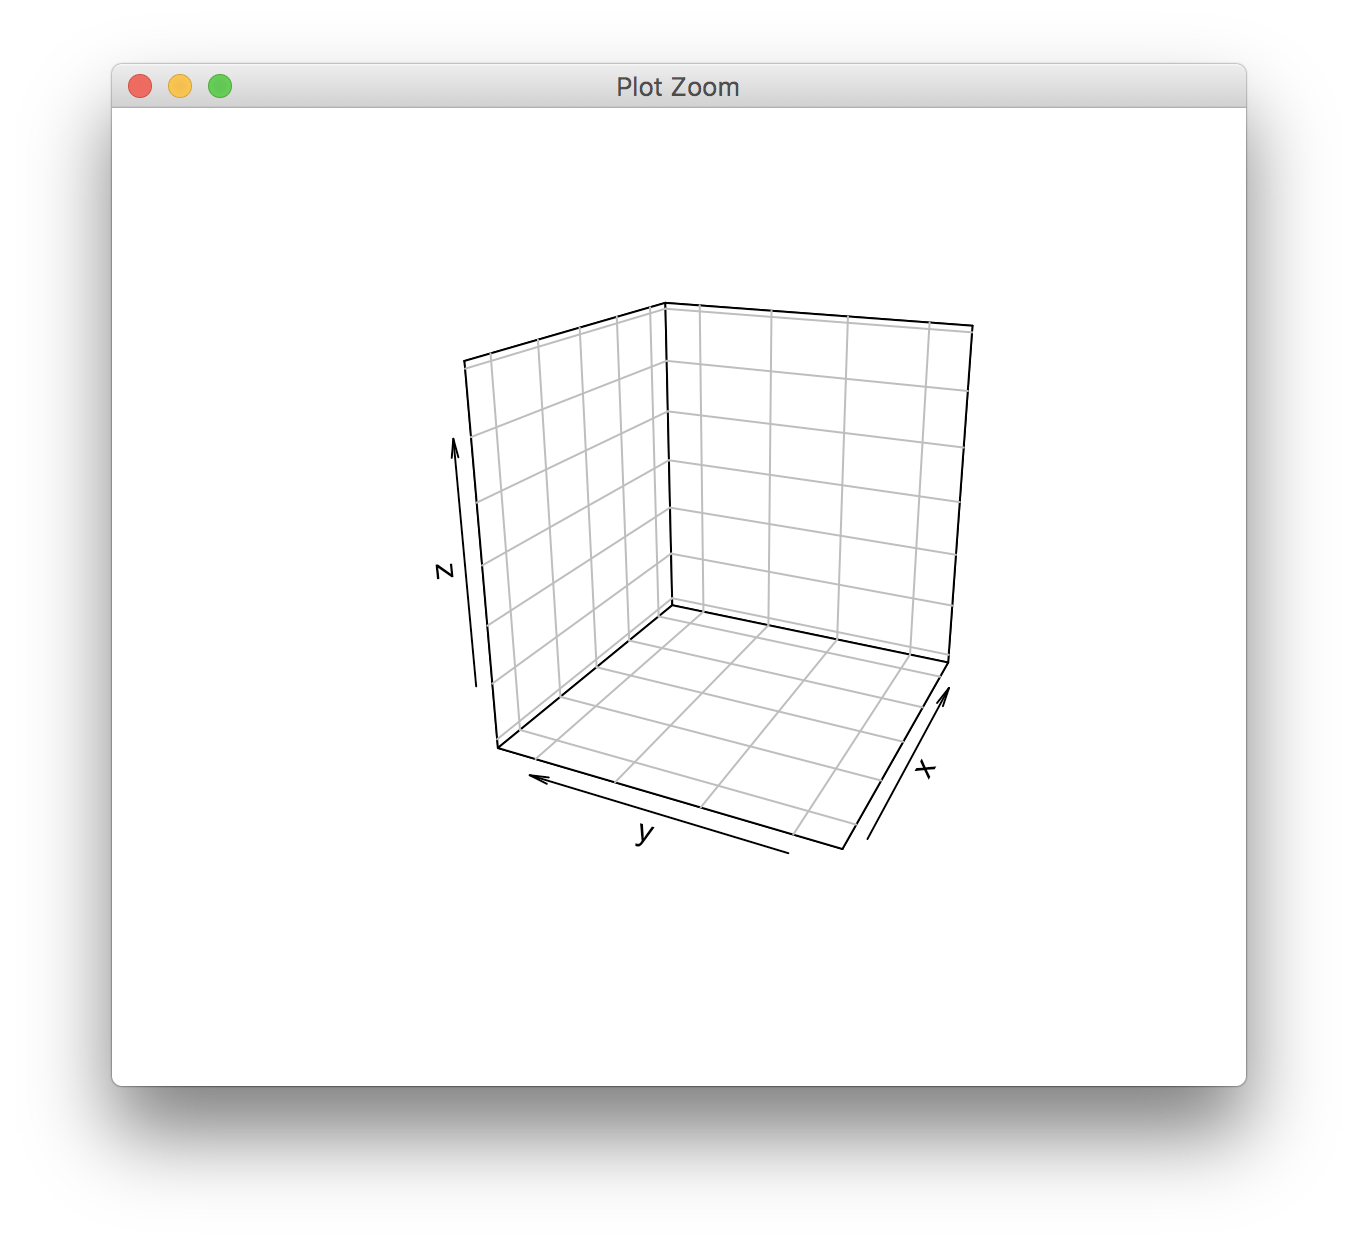
The lwd parameter is used to draw the edges of the 3D bars.
I see it. I think I have a fix, but I'd like to do a bit more testing. Hopefully later this week.
I have pushed a fix now (CRAN will have to wait a bit - I have submitted two patched versions already this year)
No problem. I keep finding little issues anyways. :-) (If you're wondering, it's for this chapter in my book: http://serialmentor.com/dataviz/no-3d.html Ironically, these are all examples for figures that one shouldn't use in practice.)
The example from above works now, but the full example from my book chapter doesn't. Here is the code:
library(plot3D)
library(gridGraphics)

pfun <- function() {
  par(xpd = NA,
      bg = "transparent",
      mai = c(0.1, 0.1, 0, 0)
  )

  hist3D(x = 1:5, y = 1:4, z = VADeaths,
         bty = "b2", phi = 20,  theta = -65,
         xlab = "", ylab = "", zlab = "deaths / 1000",
         col = "#56B4E9", border = "#01587A",
         shade = 0.2,
         ticktype = "detailed", space = .3, d = 2,
         cex.axis = 1e-9 # this line causes the problem; the setting appears to be ignored
  )
  # Use text3D to label x axis
  text3D(x = 1:5, y = rep(0.5, 5), z = rep(3, 5),
         labels = rownames(VADeaths),
         add = TRUE, adj = -0.2)
  # Use text3D to label y axis
  text3D(x = rep(0., 3), y = rep(5, 3), z = 20*(1:3),
         labels  = 20*(1:3),
         add = TRUE, adj = -1.2)
  # Use text3D to label z axis
  text3D(x = rep(1, 4), y = 1:4, z = rep(0, 4),
         labels  = colnames(VADeaths),
         add = TRUE, adj = 1)
}
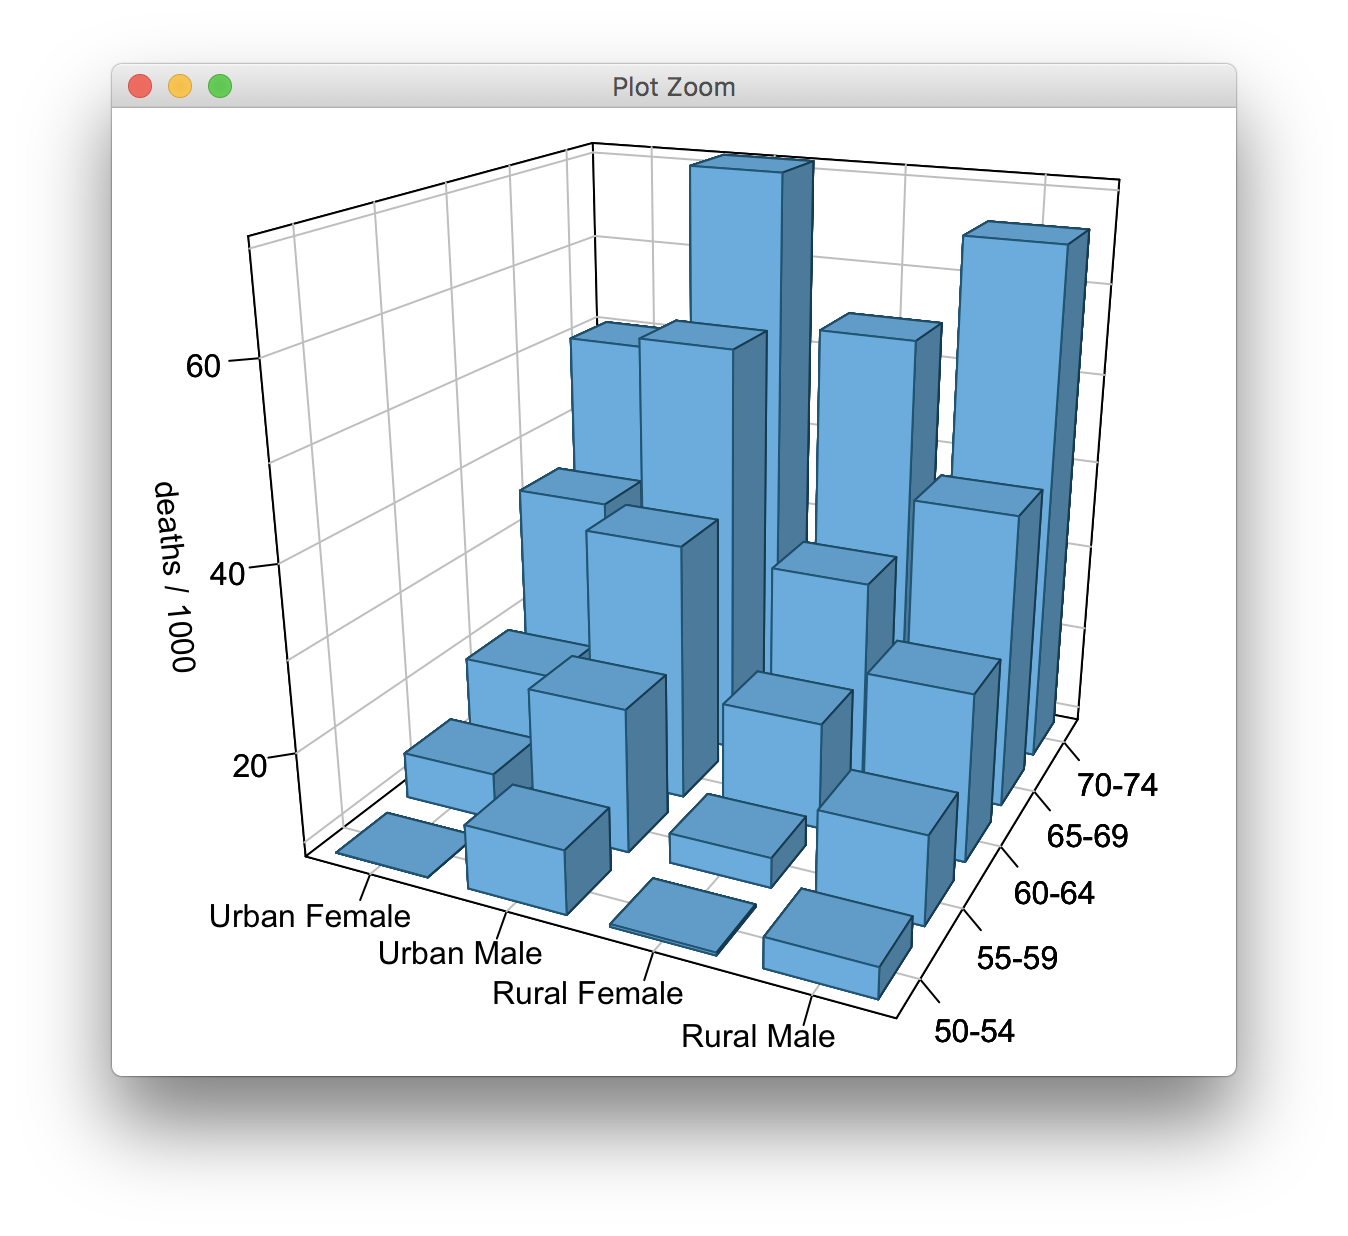
Using regular R graphics, I get this result:
pfun()
However, with grid.echo(), I get this:
grid.echo(pfun)
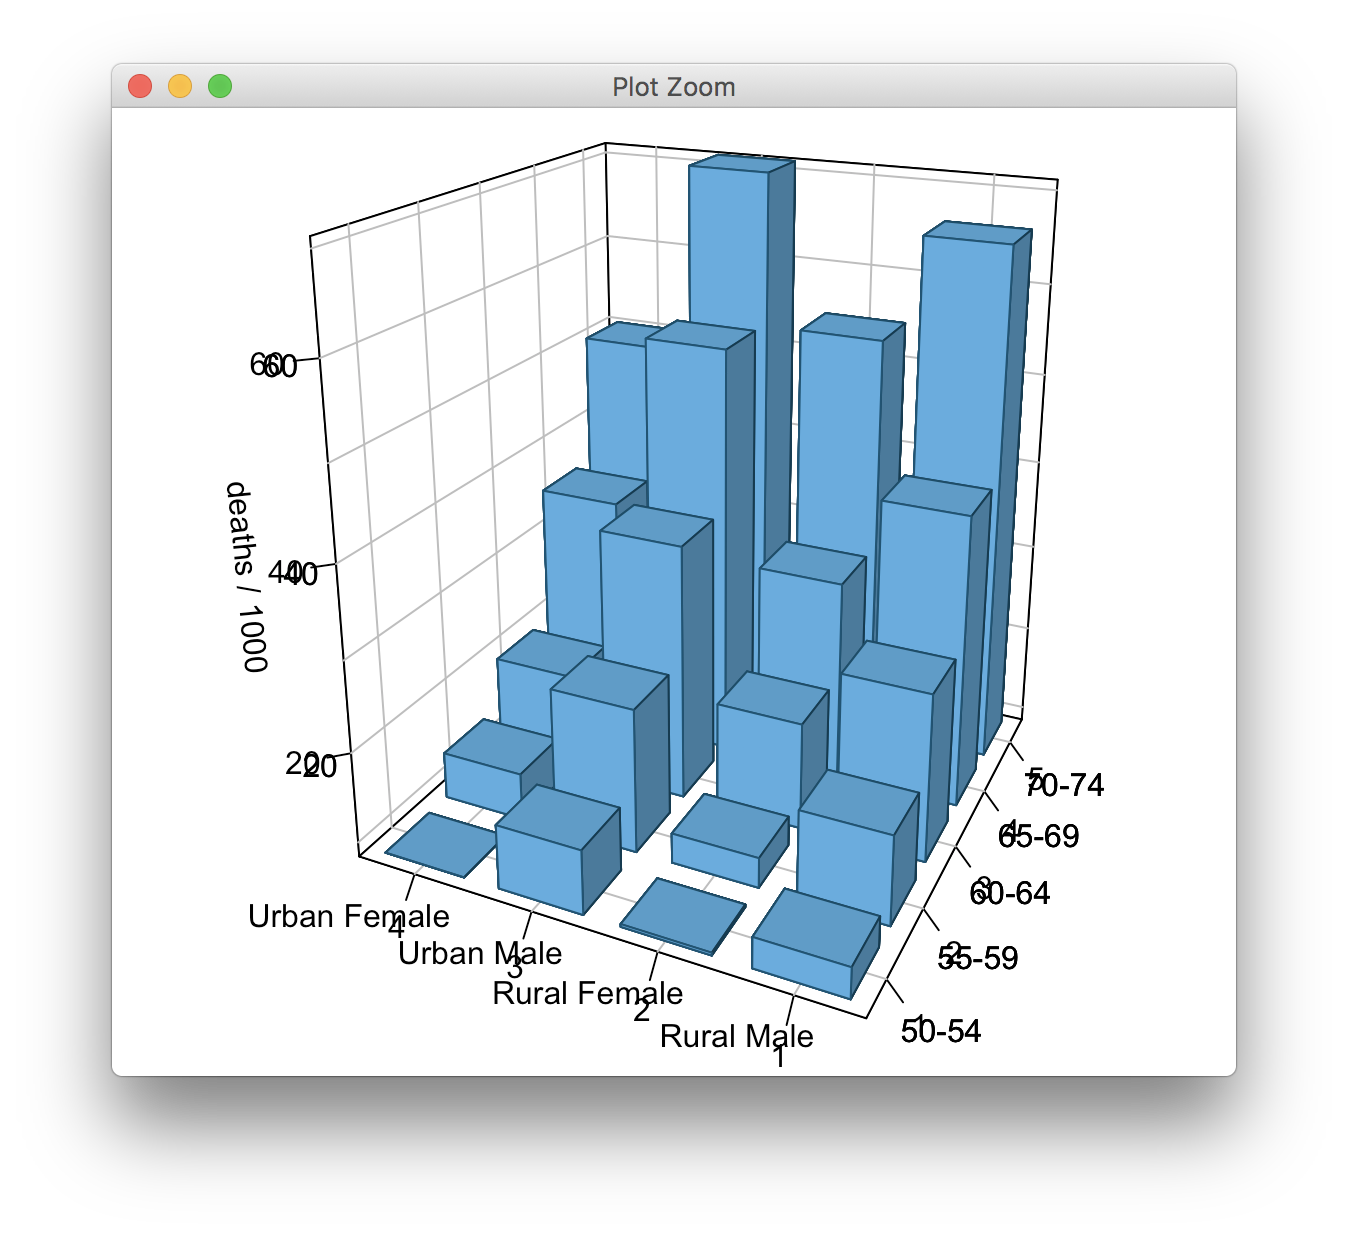
The code uses cex.axis = 1e-9 as a trick to make the default axis tick labels disappear, and this doesn't carry over with grid.echo(), so that I get double-labeling.