Heatmap histogram functionality?
I'm looking for a way to plot histogram data as a time series heat map (similar to histogram heatmap visualizations in Grafana). Is there a convenient way to plot such data in plotters?
Thanks in advance!
Just for the record, I also tried to do this. My approach was to split the canvas with split_by_breakpoints, and then use fill in each part.
While trying, I found that splitting the canvas has some precision error(?). I see the border of the splitting.
This is the plot we are thinking of
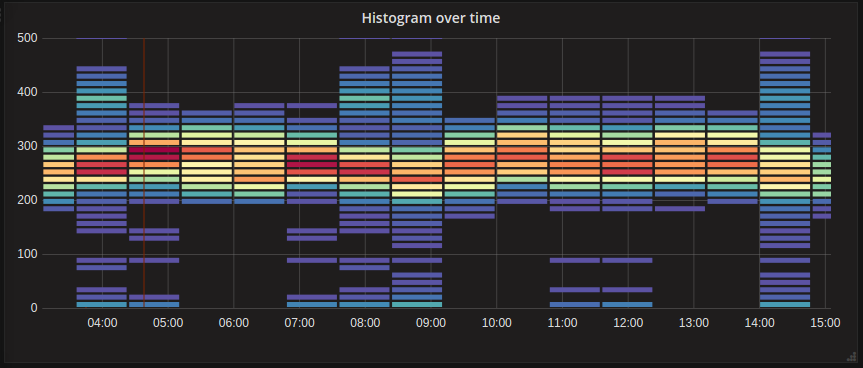 https://grafana.com/static/img/docs/v43/heatmap_histogram_over_time.png
I too would really like a time series heatmap. Has someone implemented a workable solution/workaround to plot these?
If I were to take a shot at implementing them, is there some guide on how to extend the graph types? I see there is a section in the book for extending plotters, but without content.