plotly.py

plotly.py copied to clipboard
Location of xticks is off in plotly.express
plotly version: 5.9.0 Python: 3.9.13 on Apple silicon running OSX 12.2
Reproducible example:
import pandas as pd
import plotly.express as px
df = pd.DataFrame({
    'date': pd.date_range(start='2022-01-01', end='2022-06-30', freq='1D'),
    'y': 1,
})
df['weekday'] = df['date'].dt.weekday.astype('str')
df = df.set_index('date')
df = df.groupby('weekday').resample('M').agg({'y': 'sum'}).reset_index()
px.bar(df, x=df['date'], y=df['y'], color=df['weekday'])
This leads to:

One can see that the last bar is shown above July whereas it actually corresponds to June. All xticks should be moved one month back on this graph.
To clarify the issue, the data from pandas's resample method will lead to the individual data points being shown on January 31st for January data, etc:
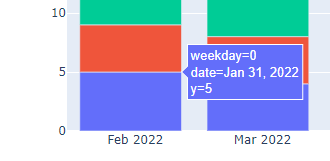
Hence, is there an easy way to move the x ticks / labels automatically so that they would show the previous month? Or align the bars so that not the center but their right side would show up at the specified date?