Hover x unified propagates the last Y value of a given trace for the next 4 x values (even though they shouldn't have values)
Describe your context Please provide us your environment, so we can easily reproduce the issue.
replace the result of pip list | grep dash below
dash 2.4.1
dash-bootstrap-components 1.0.0
dash-core-components 2.0.0
dash-daq 0.5.0
dash-html-components 2.0.0
dash-renderer 1.9.1
dash-table 5.0.0
Describe the bug
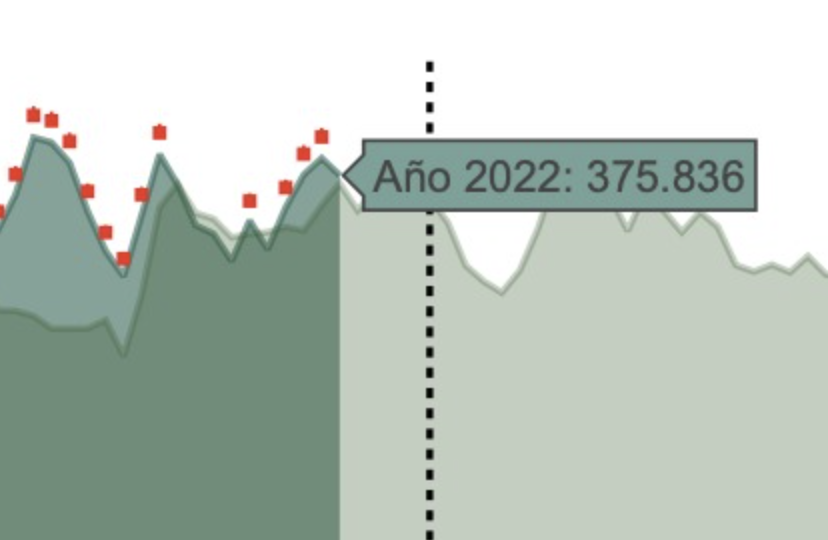
I've created a graph that has two line Scatter plots with fill to zero y and a series of annotations. One said Scatter plot has data only until to a certain point on the X axis, so that you can compare the relationship between them. Here's an example of how the graph looks:
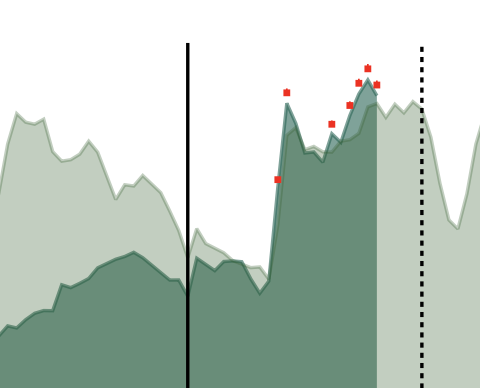
Note: The red dots represent where one trace is higher than the other.
The issue I'm raising appears only when using x unified hovermoder.
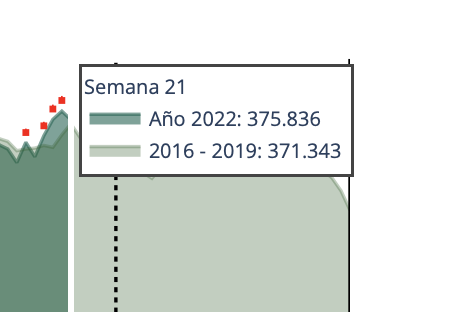
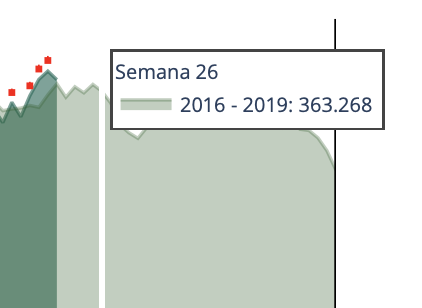
The following image shows the expected behaviour: we see data for both traces, which is accurate to the underlying dataframe
However, for the next 4 x values, we get the same data for the first trace, even though there's no data in the dataframe that's being fed. I even tried filling the dataframe with NaNs as suggested in an old issue for the same feature, to no avail.
Here are some images showing the problem:
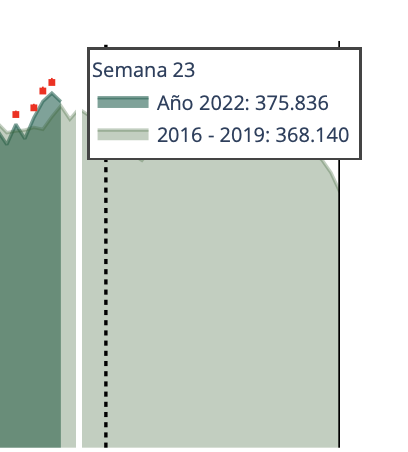
This issue goes away after 4 x values:
This problem does not arise when not using hover x unified:
I've reviewed the code and underlying data extensively and have found no reason for this behavior.
The code I'm using to create the graph is as follows:
fig = go.Figure(go.Scatter(x=x,
                           y=y_trace_a,
                           customdata = customdata,
                           hovertemplate = "Año %{customdata[0]}: %{y}<extra></extra>",
                           fill='tozeroy'),
                   layout=go.Layout(
                       showlegend=True,
                    )
               )

fig.add_trace(go.Scatter(x = x,
                           y = y_trace_b,
                           customdata = customdata,
                           hovertemplate = "2016 - 2019: %{y}<extra></extra>",
                           fill = 'tozeroy',
                      ))

   fig.update_layout(
                      xaxis={'showgrid':False, 'tickvals': x, 'ticktext': x_text}
                             'tickfont': {'size':1},
                             'visible': True,   # This is left so the hover x unified title is the x_text value
                             'color': 'white', # This hides the X axis from view while allowing its value to used for the hover x unified title.
                             'fixedrange':True
                            },
                      showlegend=False,
                      separators = '..',
                      hovermode='x unified',
                     )
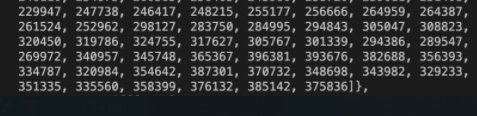
Here's a printout of the fig:
Figure({
'data': [{'customdata': array([[[2020],
['Semana 1']],
[[2020],
['Semana 2']],
[[2020],
['Semana 3']],
...,
[[2022],
['Semana 50']],
[[2022],
['Semana 51']],
[[2022],
['Semana 52']]], dtype=object),
'fill': 'tozeroy',
'hovertemplate': 'Año %{customdata[0]}: %{y}<extra></extra>',
'name': '',
'type': 'scatter',
'x': [1, 2, 3, 4, 5, 6, 7, 8, 9, 10, 11, 12, 13, 14, 15, 16, 17, 18,
19, 20, 21, 22, 23, 24, 25, 26, 27, 28, 29, 30, 31, 32, 33, 34,
35, 36, 37, 38, 39, 40, 41, 42, 43, 44, 45, 46, 47, 48, 49, 50,
51, 52, 53, 54, 55, 56, 57, 58, 59, 60, 61, 62, 63, 64, 65, 66,
67, 68, 69, 70, 71, 72, 73, 74, 75, 76, 77, 78, 79, 80, 81, 82,
83, 84, 85, 86, 87, 88, 89, 90, 91, 92, 93, 94, 95, 96, 97, 98,
99, 100, 101, 102, 103, 104, 105, 106, 107, 108, 109, 110, 111,
112, 113, 114, 115, 116, 117, 118, 119, 120, 121, 122, 123,
124, 125],
'y': [401650, 318171, 312559, 317563, 311235, 302657, 305405,
311901, 257635, 312996, 356901, 241803, 167839, 157012, 145529,
149502, 151726, 164478, 165652, 167021, 164787, 161270, 153026,
148889, 145265, 145179, 151158, 158540, 168095, 170325, 170076,
175423, 170287, 180931, 183932, 193266, 200232, 198424, 228065,
209919, 217895, 224910, 228322, 228881, 239620, 242948, 244635,
252676, 248746, 248783, 239150, 237487, 259313, 244904, 249159,
243371, 243348, 247632, 249525, 258345, 266802, 271594, 263094,
253948, 244991, 241749, 244026, 233086, 226980, 226048, 239547,
246110, 254873, 260365, 256463, 243960, 238720, 239611, 231408,
229947, 247738, 246417, 248215, 255177, 256666, 264959, 264387,
261524, 252962, 298127, 283750, 284995, 294843, 305047, 308823,
320450, 319786, 324755, 317627, 305767, 301339, 294386, 289547,
269972, 340957, 345748, 365367, 396381, 393676, 382688, 356393,
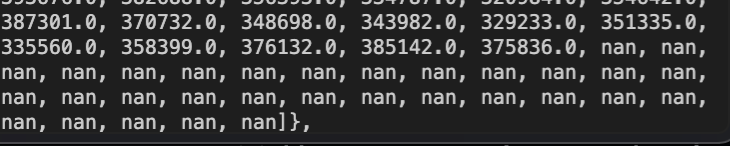
334787, 320984, 354642, 387301, 370732, 348698, 343982, 329233,
351335, 335560, 358399, 376132, 385142, 375836]},
{'customdata': array([[[2020],
['Semana 1']],
[[2020],
['Semana 2']],
[[2020],
['Semana 3']],
...,
[[2022],
['Semana 50']],
[[2022],
['Semana 51']],
[[2022],
['Semana 52']]], dtype=object),
'fill': 'tozeroy',
'hovertemplate': '2016 - 2019: %{y}<extra></extra>',
'type': 'scatter',
'x': [1, 2, 3, 4, 5, 6, 7, 8, 9, 10, 11, 12, 13, 14, 15, 16, 17, 18,
19, 20, 21, 22, 23, 24, 25, 26, 27, 28, 29, 30, 31, 32, 33, 34,
35, 36, 37, 38, 39, 40, 41, 42, 43, 44, 45, 46, 47, 48, 49, 50,
51, 52, 53, 54, 55, 56, 57, 58, 59, 60, 61, 62, 63, 64, 65, 66,
67, 68, 69, 70, 71, 72, 73, 74, 75, 76, 77, 78, 79, 80, 81, 82,
83, 84, 85, 86, 87, 88, 89, 90, 91, 92, 93, 94, 95, 96, 97, 98,
99, 100, 101, 102, 103, 104, 105, 106, 107, 108, 109, 110, 111,
112, 113, 114, 115, 116, 117, 118, 119, 120, 121, 122, 123,
124, 125, 126, 127, 128, 129, 130, 131, 132, 133, 134, 135,
136, 137, 138, 139, 140, 141, 142, 143, 144, 145, 146, 147,
148, 149, 150, 151, 152, 153, 154, 155, 156],
'y': [319060, 302510, 302211, 299464, 292566, 292858, 292578,
297242, 277582, 310834, 358396, 371168, 355314, 352236, 342176,
343962, 344966, 347872, 345794, 359429, 371343, 356749, 368140,
361565, 370718, 363268, 350283, 326831, 318242, 312164, 324153,
346620, 375306, 365685, 360877, 364718, 345628, 368124, 355886,
344974, 356074, 347849, 327064, 323538, 327370, 323196, 331992,
321999, 320712, 312630, 298640, 277530, 319060, 302510, 302211,
299464, 292566, 292858, 292578, 297242, 277582, 310834, 358396,
371168, 355314, 352236, 342176, 343962, 344966, 347872, 345794,
359429, 371343, 356749, 368140, 361565, 370718, 363268, 350283,
326831, 318242, 312164, 324153, 346620, 375306, 365685, 360877,
364718, 345628, 368124, 355886, 344974, 356074, 347849, 327064,
323538, 327370, 323196, 331992, 321999, 320712, 312630, 298640,
277530, 319060, 302510, 302211, 299464, 292566, 292858, 292578,
297242, 277582, 310834, 358396, 371168, 355314, 352236, 342176,
343962, 344966, 347872, 345794, 359429, 371343, 356749, 368140,
361565, 370718, 363268, 350283, 326831, 318242, 312164, 324153,
346620, 375306, 365685, 360877, 364718, 345628, 368124, 355886,
344974, 356074, 347849, 327064, 323538, 327370, 323196, 331992,
321999, 320712, 312630, 298640, 277530]},
{'hoverinfo': 'skip',
'line': {'color': 'black'},
'mode': 'lines',
'type': 'scatter',
'x': [1, 1],
'y': [0, 441815.00000000006]},
{'hoverinfo': 'skip',
'line': {'color': 'black', 'dash': 'dot'},
'mode': 'lines',
'type': 'scatter',
'x': [26, 26],
'y': [0, 441815.00000000006]},
{'hoverinfo': 'skip',
'line': {'color': 'black'},
'mode': 'lines',
'type': 'scatter',
'x': [52, 52],
'y': [0, 441815.00000000006]},
{'hoverinfo': 'skip',
'line': {'color': 'black', 'dash': 'dot'},
'mode': 'lines',
'type': 'scatter',
'x': [78, 78],
'y': [0, 441815.00000000006]},
{'hoverinfo': 'skip',
'line': {'color': 'black'},
'mode': 'lines',
'type': 'scatter',
'x': [104, 104],
'y': [0, 441815.00000000006]},
{'hoverinfo': 'skip',
'line': {'color': 'black', 'dash': 'dot'},
'mode': 'lines',
'type': 'scatter',
'x': [130, 130],
'y': [0, 441815.00000000006]},
{'hoverinfo': 'skip',
'line': {'color': 'black'},
'mode': 'lines',
'type': 'scatter',
'x': [156, 156],
'y': [0, 441815.00000000006]}],
'layout': {'annotations': [{'arrowcolor': 'red',
'arrowhead': 7,
'arrowsize': 1,
'arrowwidth': 1,
'ax': 105,
'axref': 'x',
'ay': 358004.85000000003,
'ayref': 'y',
'showarrow': True,
'text': '',
'x': 105,
'xref': 'x',
'y': 351185.71,
'yref': 'y'},
{'arrowcolor': 'red',
'arrowhead': 7,
'arrowsize': 1,
'arrowwidth': 1,
'ax': 106,
'axref': 'x',
'ay': 363035.4,
'ayref': 'y',
'showarrow': True,
'text': '',
'x': 106,
'xref': 'x',
'y': 356120.44,
'yref': 'y'},
{'arrowcolor': 'red',
'arrowhead': 7,
'arrowsize': 1,
'arrowwidth': 1,
'ax': 107,
'axref': 'x',
'ay': 383635.35000000003,
'ayref': 'y',
'showarrow': True,
'text': '',
'x': 107,
'xref': 'x',
'y': 376328.01,
'yref': 'y'},
{'arrowcolor': 'red',
'arrowhead': 7,
'arrowsize': 1,
'arrowwidth': 1,
'ax': 108,
'axref': 'x',
'ay': 416200.05000000005,
'ayref': 'y',
'showarrow': True,
'text': '',
'x': 108,
'xref': 'x',
'y': 408272.43,
'yref': 'y'},
{'arrowcolor': 'red',
'arrowhead': 7,
'arrowsize': 1,
'arrowwidth': 1,
'ax': 109,
'axref': 'x',
'ay': 413359.80000000005,
'ayref': 'y',
'showarrow': True,
'text': '',
'x': 109,
'xref': 'x',
'y': 405486.28,
'yref': 'y'},
{'arrowcolor': 'red',
'arrowhead': 7,
'arrowsize': 1,
'arrowwidth': 1,
'ax': 110,
'axref': 'x',
'ay': 401822.4,
'ayref': 'y',
'showarrow': True,
'text': '',
'x': 110,
'xref': 'x',
'y': 394168.64,
'yref': 'y'},
{'arrowcolor': 'red',
'arrowhead': 7,
'arrowsize': 1,
'arrowwidth': 1,
'ax': 111,
'axref': 'x',
'ay': 374212.65,
'ayref': 'y',
'showarrow': True,
'text': '',
'x': 111,
'xref': 'x',
'y': 367084.79000000004,
'yref': 'y'},
{'arrowcolor': 'red',
'arrowhead': 7,
'arrowsize': 1,
'arrowwidth': 1,
'ax': 112,
'axref': 'x',
'ay': 351526.35000000003,
'ayref': 'y',
'showarrow': True,
'text': '',
'x': 112,
'xref': 'x',
'y': 344830.61,
'yref': 'y'},
{'arrowcolor': 'red',
'arrowhead': 7,
'arrowsize': 1,
'arrowwidth': 1,
'ax': 113,
'axref': 'x',
'ay': 337033.2,
'ayref': 'y',
'showarrow': True,
'text': '',
'x': 113,
'xref': 'x',
'y': 330613.52,
'yref': 'y'},
{'arrowcolor': 'red',
'arrowhead': 7,
'arrowsize': 1,
'arrowwidth': 1,
'ax': 114,
'axref': 'x',
'ay': 372374.10000000003,
'ayref': 'y',
'showarrow': True,
'text': '',
'x': 114,
'xref': 'x',
'y': 365281.26,
'yref': 'y'},
{'arrowcolor': 'red',
'arrowhead': 7,
'arrowsize': 1,
'arrowwidth': 1,
'ax': 115,
'axref': 'x',
'ay': 406666.05,
'ayref': 'y',
'showarrow': True,
'text': '',
'x': 115,
'xref': 'x',
'y': 398920.03,
'yref': 'y'},
{'arrowcolor': 'red',
'arrowhead': 7,
'arrowsize': 1,
'arrowwidth': 1,
'ax': 120,
'axref': 'x',
'ay': 368901.75,
'ayref': 'y',
'showarrow': True,
'text': '',
'x': 120,
'xref': 'x',
'y': 361875.05,
'yref': 'y'},
{'arrowcolor': 'red',
'arrowhead': 7,
'arrowsize': 1,
'arrowwidth': 1,
'ax': 122,
'axref': 'x',
'ay': 376318.95,
'ayref': 'y',
'showarrow': True,
'text': '',
'x': 122,
'xref': 'x',
'y': 369150.97000000003,
'yref': 'y'},
{'arrowcolor': 'red',
'arrowhead': 7,
'arrowsize': 1,
'arrowwidth': 1,
'ax': 123,
'axref': 'x',
'ay': 394938.60000000003,
'ayref': 'y',
'showarrow': True,
'text': '',
'x': 123,
'xref': 'x',
'y': 387415.96,
'yref': 'y'},
{'arrowcolor': 'red',
'arrowhead': 7,
'arrowsize': 1,
'arrowwidth': 1,
'ax': 124,
'axref': 'x',
'ay': 404399.10000000003,
'ayref': 'y',
'showarrow': True,
'text': '',
'x': 124,
'xref': 'x',
'y': 396696.26,
'yref': 'y'},
{'arrowhead': 1, 'showarrow': True, 'text': 'placeholder', 'x': 11, 'y': 373079.7},
{'arrowhead': 1,
'showarrow': True,
'text': 'placeholder',
'x': 38,
'y': 362222.7},
{'arrowhead': 1,
'showarrow': True,
'text': 'placeholder',
'x': 38,
'y': 220414.95},
{'arrowhead': 1,
'showarrow': True,
'text': 'placeholder',
'x': 68,
'y': 365265.60000000003},
{'arrowhead': 1,
'showarrow': True,
'text': 'placeholder',
'x': 68,
'y': 237350.40000000002},
{'showarrow': False, 'text': 'placeholder', 'x': 13, 'y': -13388.333333333334},
{'showarrow': False, 'text': 'placeholder', 'x': 39, 'y': -13388.333333333334},
{'showarrow': False, 'text': 'placeholder', 'x': 65, 'y': -13388.333333333334},
{'showarrow': False, 'text': 'placeholder', 'x': 91, 'y': -13388.333333333334},
{'showarrow': False, 'text': 'placeholder', 'x': 117, 'y': -13388.333333333334},
{'showarrow': False, 'text': 'placeholder', 'x': 143, 'y': -13388.333333333334}],
'height': 450,
'hovermode': 'x unified',
'paper_bgcolor': 'rgba(255,255,255,1)',
'plot_bgcolor': 'rgba(255,255,255,1)',
'separators': '..',
'showlegend': False,
'template': '...',
'title': {'text': 'placeholder', 'x': 0.5},
'width': 1000,
'xaxis': {'color': 'white',
'fixedrange': True,
'showgrid': False,
'tickfont': {'size': 1},
'ticktext': [Semana 1, Semana 2, Semana 3, Semana 4,
Semana 5, Semana 6, Semana 7, Semana 8,
Semana 9, Semana 10, Semana 11, Semana 12,
Semana 13, Semana 14, Semana 15, Semana 16,
Semana 17, Semana 18, Semana 19, Semana 20,
Semana 21, Semana 22, Semana 23, Semana 24,
Semana 25, Semana 26, Semana 27, Semana 28,
Semana 29, Semana 30, Semana 31, Semana 32,
Semana 33, Semana 34, Semana 35, Semana 36,
Semana 37, Semana 38, Semana 39, Semana 40,
Semana 41, Semana 42, Semana 43, Semana 44,
Semana 45, Semana 46, Semana 47, Semana 48,
Semana 49, Semana 50, Semana 51, Semana 52,
Semana 1, Semana 2, Semana 3, Semana 4,
Semana 5, Semana 6, Semana 7, Semana 8,
Semana 9, Semana 10, Semana 11, Semana 12,
Semana 13, Semana 14, Semana 15, Semana 16,
Semana 17, Semana 18, Semana 19, Semana 20,
Semana 21, Semana 22, Semana 23, Semana 24,
Semana 25, Semana 26, Semana 27, Semana 28,
Semana 29, Semana 30, Semana 31, Semana 32,
Semana 33, Semana 34, Semana 35, Semana 36,
Semana 37, Semana 38, Semana 39, Semana 40,
Semana 41, Semana 42, Semana 43, Semana 44,
Semana 45, Semana 46, Semana 47, Semana 48,
Semana 49, Semana 50, Semana 51, Semana 52],
'tickvals': [1, 2, 3, 4, 5, 6, 7, 8, 9, 10, 11, 12, 13,
14, 15, 16, 17, 18, 19, 20, 21, 22, 23, 24,
25, 26, 27, 28, 29, 30, 31, 32, 33, 34, 35,
36, 37, 38, 39, 40, 41, 42, 43, 44, 45, 46,
47, 48, 49, 50, 51, 52, 53, 54, 55, 56, 57,
58, 59, 60, 61, 62, 63, 64, 65, 66, 67, 68,
69, 70, 71, 72, 73, 74, 75, 76, 77, 78, 79,
80, 81, 82, 83, 84, 85, 86, 87, 88, 89, 90,
91, 92, 93, 94, 95, 96, 97, 98, 99, 100, 101,
102, 103, 104, 105, 106, 107, 108, 109, 110,
111, 112, 113, 114, 115, 116, 117, 118, 119,
120, 121, 122, 123, 124, 125, 126, 127, 128,
129, 130, 131, 132, 133, 134, 135, 136, 137,
138, 139, 140, 141, 142, 143, 144, 145, 146,
147, 148, 149, 150, 151, 152, 153, 154, 155,
156],
'title': {'text': 'placeholder'},
'visible': True},
'yaxis': {'fixedrange': True,
'tickformat': ',.0f',
'title': {'text': 'placeholder'}}}
})
Looking forward to hearing back from you! Thanks!
Yes, that's an annoying case. hovermode="x unified" and hovermode="x" both show this behavior, where as long as you're within the hoverdistance (default ~25 px) of the x position of the last point in a trace, it will still be included in the hover set even though there's a point in another trace with a better-matched x value. @nicolaskruchten somehow I thought we had a solution to this case (saying "whatever the best X value is, require any other point in the hover set to have exactly matching X"), but I can't find it. We've certainly discussed it at length...
You can prevent this by including at least one point at the end of the shorter trace, with the next X value included but NaN or None in the Y array.
Here's a minimal example showing your problem:
import plotly.express as px
x = list(range(1000)) + list(range(500))
y = [math.sin(i/100) for i in range(1500)]
c = ["a"] * 1000 + ["b"] * 500
px.scatter(x=x,y=y,color=c).update_layout(hovermode="x unified")

And fixing it by adding the next X with null Y:
import plotly.express as px
x = list(range(1000)) + list(range(501))
y = [math.sin(i/100) for i in range(1500)] + [None]
c = ["a"] * 1000 + ["b"] * 501
px.scatter(x=x,y=y,color=c).update_layout(hovermode="x unified")
