plotly.py

plotly.py copied to clipboard
Surface Plot not potting values properly when there is only one piece of data in a row or column of the data
Here is the data I wanted to plot: [[0.45 nan nan nan] [0.25 0.4 nan nan] [0.35 0.25 0.4 nan] [0.4 0.25 0.5 0.25]]
in my code, this is stored in the variable 'result'
my code is the following: `fig = go.Figure(data=[ go.Surface(z=result) ])
fig.update_layout(scene = dict( xaxis_title='X axis', yaxis_title='Y axis', zaxis_title='Z axis'), width=700, margin=dict(r=20, b=10, l=10, t=10))
fig.show()`
the resulting graph is this:
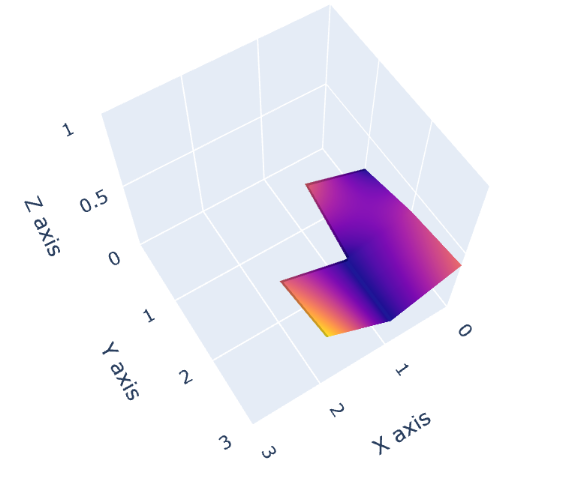
as you can see, 0.45 in the first row of the data is not plotted and 0.25 in the last column of the data is not plotted. **note: I had to remove a bunch of code in my example for privacy purposes, but this still illustrates the bug.