plotly.py

plotly.py copied to clipboard
Violin plot with 'name' attribute set as Datetime get's flattened out
I'm trying to make a horizontally oriented ridge plot . Following is the code plotly.version == 5.3.1
Ridgeline plot
base_date = dt.datetime.strptime(start_date,'%Y-%m-%d')
fig = go.Figure()

for day in range(days) :
                    offset = dt.timedelta(days=day)
                    date = (base_date + offset).strftime('%Y-%m-%d')
                    violin_plot_data = swData[date]
                    fig.add_trace(go.Violin(x = violin_plot_data.loc[:,metric_name] ,
                                                    orientation = 'h',
                                                    width = 3 ,
                                                    side = 'positive',
                                                    meanline_visible=True,
                                                    points = False
                                                   )
                                         )

fig.show()
I'm getting the following output :

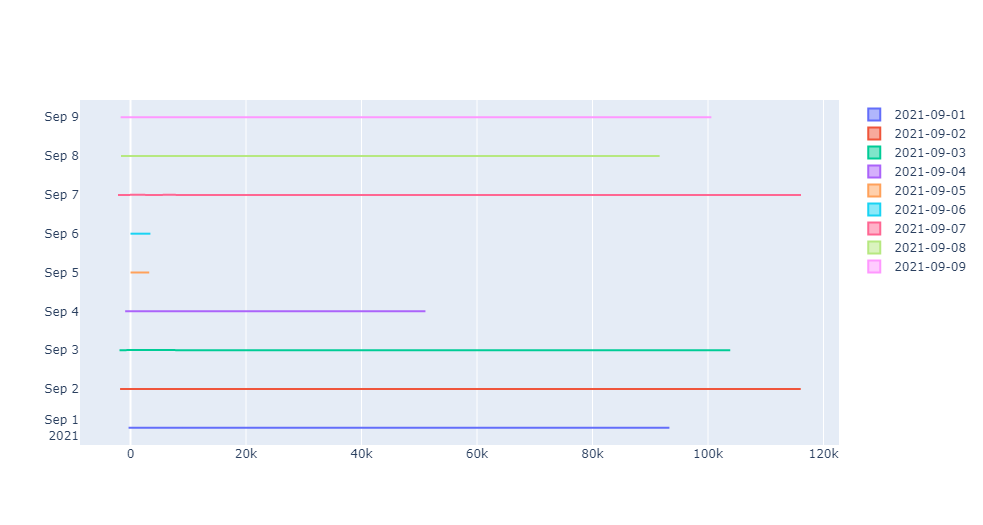
However I wish to set "name" attribute for individual dates . I did the following
Ridgelin plot
base_date = dt.datetime.strptime(start_date,'%Y-%m-%d')
fig = go.Figure()

for day in range(days) :
    offset = dt.timedelta(days=day)
    date = (base_date + offset).strftime('%Y-%m-%d')
    violin_plot_data = swData[date]
    fig.add_trace(go.Violin(x = violin_plot_data.loc[:,metric_name] ,
                                    orientation = 'h',
                                    width = 3 ,
                                    side = 'positive',
                                    name = date,
                                    meanline_visible=True,
                                    points = False
                                   )
                         )
fig.show()
The output that I'm getting is
Kindly clarify if it's a bug in the framework or a silly mistake from my side . TY :)
EDIT : I've found a work around and answered it here [https://stackoverflow.com/a/69894008/6571670] but I feel Plotly should be able to parse dates explicitly