harmonized ECDF between "h" and "v", removed "reversed" mode; polishe…
Changes
px.ecdf functionality
I changed three aspects of the ECDF functionality:
- The plotted line always spans from 0 to 1 instead of omitting the first step (or last step in case of
'complementary'). - Harmonized the plot output such that
x=values,y=weights,orientation='v'is the EXACT transpose ofy=values,x=weights,orientation='h'. This symmetry was lacking in the former implementation as can be seen in the examples mentioned below. - The redundant
'reversed'option has been removed as it was essentially a copy of'complementary'with the opposite end omitted.
Example plots of original functionality:

Example plots of updated functionality now exhibiting proper symmetry:

Above images were produced with
import numpy as np
import pandas as pd
import plotly.express as px
import panel as pn

data = pd.DataFrame({'first':np.arange(1,7),
                     'second':[20.56,22.17,23.66,25.3,25.9,27.7],
                     'weights':1+np.arange(6),
                     'reversed':6-np.arange(6),
                    })

grid = pn.GridSpec(ncols=4,nrows=2,height=800,width=1600)

for i,mode in enumerate(['standard','complementary']):
    for k,orientation in enumerate(['v','h']):
        for j,x in enumerate([True,False]):
            grid[i,2*j+k] = px.ecdf(data,
                                x=['first','second'] if x else 'weights',
                                y='weights' if x else ['first','second'],
                                orientation=orientation,
                                range_x={'v':[0,30] if x else [0,10],
                                         'h':[0,1]}[orientation],
                                range_y={'v':[0,1],
                                         'h':[0,10] if x else [0,30]}[orientation],
                                ecdfmode=mode,
                                width=400,
                                title=f'{mode} {orientation} {"x" if x else "y"}',
                               )

grid
px doc-strings
- Corrected some spelling mistakes.
- Unified format of first and second lines across parameters.
Code PR
- [x] I have read through the contributing notes and understand the structure of the package. In particular, if my PR modifies code of
plotly.graph_objects, my modifications concern thecodegenfiles and not generated files. - [ ] I have added tests (if submitting a new feature or correcting a bug) or modified existing tests.
- [ ] For a new feature, I have added documentation examples in an existing or new tutorial notebook (please see the doc checklist as well).
- [ ] I have added a CHANGELOG entry if fixing/changing/adding anything substantial.
- [x] For a new feature or a change in behaviour, I have updated the relevant docstrings in the code to describe the feature or behaviour (please see the doc checklist as well).
Thanks for this PR! I'll be able to take a look at it next week, before the next release :)
Have a nice weekend!
One quick note is that I will not be able to merge this as-is given that it removes functionality. We still need to accept reversed as an argument for backwards-compatibility. If you want to propose to make this equivalent to complementary we'd need to implement and document that in the docstring :)
Hi,
I see, yes, that seems a good way of dealing with it. Do you have some language to that effect? I would suggest:
One of 'standard', 'complementary', or 'reversed'.
…
'reversed' is deprecated as it was equivalent to 'complementary'.
Cheers Philip
PS: I will need to fix the code because “black” currently complains (forgot to check that ahead of time!)
On Oct 1, 2021, at 5:16 PM, Nicolas Kruchten @.***> wrote:
One quick note is that I will not be able to merge this as-is given that it removes functionality. We still need to accept reversed as an argument for backwards-compatibility. If you want to propose to make this equivalent to complementary we'd need to implement and document that in the docstring :)
— You are receiving this because you authored the thread. Reply to this email directly, view it on GitHub https://github.com/plotly/plotly.py/pull/3407#issuecomment-932580700, or unsubscribe https://github.com/notifications/unsubscribe-auth/ABRZ5BCFYJO75KREXXOXYH3UEYQKTANCNFSM5FFQEYZA. Triage notifications on the go with GitHub Mobile for iOS https://apps.apple.com/app/apple-store/id1477376905?ct=notification-email&mt=8&pt=524675 or Android https://play.google.com/store/apps/details?id=com.github.android&referrer=utm_campaign%3Dnotification-email%26utm_medium%3Demail%26utm_source%3Dgithub.
Dr. Philip Eisenlohr
Associate Professor Computational Materials Mechanics Department of Chemical Engineering and Materials Science Adjunct Associate Professor Department of Physics and Astronomy Michigan State University
+1 517 432-4506 @.*** https://www.researchgate.net/profile/Philip_Eisenlohr
Hello @eisenlohr! I'm sorry for the long delays in responding here, I've gotten very far behind in my work! I will try to review this before the end of the year.
I do have some hesitations about the idea of merging reverse and complementary, as they don't really mean the same thing... from the docstring:
If 'standard', the ECDF is plotted such that values represent data at or below the point. If 'complementary', the CCDF is plotted such that values represent data above the point. If 'reversed', a variant of the CCDF is plotted such that values represent data at or above the point.
The complementary ECDF is 1-ECDF, so the definitions of standard and complementary are correct here. I added reverse mode because, indeed, there was a missing point.
As to the idea of adding an extra point to the series, I am also ambivalent, as this point is not in the underlying data, and will cause duplicated hoverlabels: the 'extra' point will have the same hover_data as the point it was copied from, even though it's not a "real" data point.
Hi @nicolaskruchten,
Thanks for giving this some thought. My MR addresses a couple of (somewhat independent) aspects.
-
I would expect the output of
h x(orv x) to be a transpose ofv y(orh y) when using the same input data. This was not the case in the current implementation (see diagrams above). -
The standard definition of cumulative probability is based on 'up to and including'. I think we are in violent agreement that what is called 'standard' and 'complementary' should be (and is) a mirror image. Where I deviate is in seeing a meaningful reason for modifying the classical definition and using 'up to but excluding', i.e. what was called 'reversed'. In my opinion, there is only one way to use and interpret the cumulative probability: if it is P for up to and including x, then it is 1-P for down to and excluding x. Therefore, no need for 'reversed'. Moreover, for the current (your) implementation, there is essentially no difference (except for the missing "closure" at either 1 or 0) between the choice of 'complementary' and 'reversed' in case of the (in my opinion principally correct)
v xplot:


-
Spanning the full range from zero to one appeared to be the usual way for ECDF plots. If one would be really pedantic, the plots should actually extend from -infty at zero cum probabilty to +infty at 1 cum probabilty, i.e. have horizontal (in the
standard v xplot) "legs" at the bottom left and top right. Ignoring this detail, the only option that I was able to come up with was to add a copy of the lowest value at a cum prob of zero. In light of what I wrote above, the more appropriate choice might actually be -infty. However, then the plot would look lopsided, since only one of the mentioned "legs" is present... The cleanest look resulted from the choice I proposed in the MR. I agree that the hover information would be a copy, but am not certain whether this would actually be a serious concern?
In summary, I believe that most of the confusion arose due to "1." not being correct, i.e. the current implementation does not yield properly transposed images. Once this is fixed, then it becomes apparent that there is no difference anymore between plots that would result from 'complementary' compared to 'reversed'.
Hi @nicolaskruchten ,
Did you get a chance to contemplate my above remarks?
Many greetings, Philip
Hi Philip,
I sincerely apologize for letting this languish for so long... I've been a bit distracted by various life events recently (I've just started graduate school!) so I'm behind in Plotly.py work like reviewing PRs. I will definitely try to merge some or all of this PR in an upcoming release :)
Cheers, Nicolas
Hi @nicolaskruchten, to lend some further support to the argument I made regarding item 3 above, the ECDF is plotted in the same way, i.e. spanning fully between 0 and 1, in Seaborn (see second-to-last example at https://seaborn.pydata.org/generated/seaborn.displot.html#seaborn.displot).
Hi @nicolaskruchten, I am trying another ping at this.
The Seaborn image I was referring to in my previous post is this:
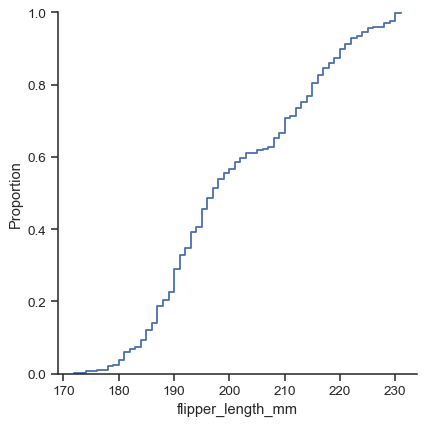
@nicolaskruchten, there is another argument that I would like to stress: the cumulative probability for a single-valued population should be a step function at that value.
This is indeed reflected in the output of Seaborn, but not (yet) in plotly.express:
import pandas as pd
import seaborn as sns
import plotly.express as px

df = pd.DataFrame(dict(x=[1]))
sns.displot(data=df,
            x='x',
            kind='ecdf',
           ).savefig('ECDF_seaborn.png')
px.ecdf(df,
        x='x',
       ).write_image('ECDF_plotlyexpress.png')
Seaborn output

Ploty.express output

Thank you for your persistence with this issue! I'm still quite embarassed at how long it has been open and how hard it has been for me to find time to properly consider it and I continue to apologize. Your arguments make sense, so my silence is not intended as passive disagreement!
@nicolaskruchten, no offense taken. I am aware that there is always more to do than hours in a day!