plotly.py

plotly.py copied to clipboard
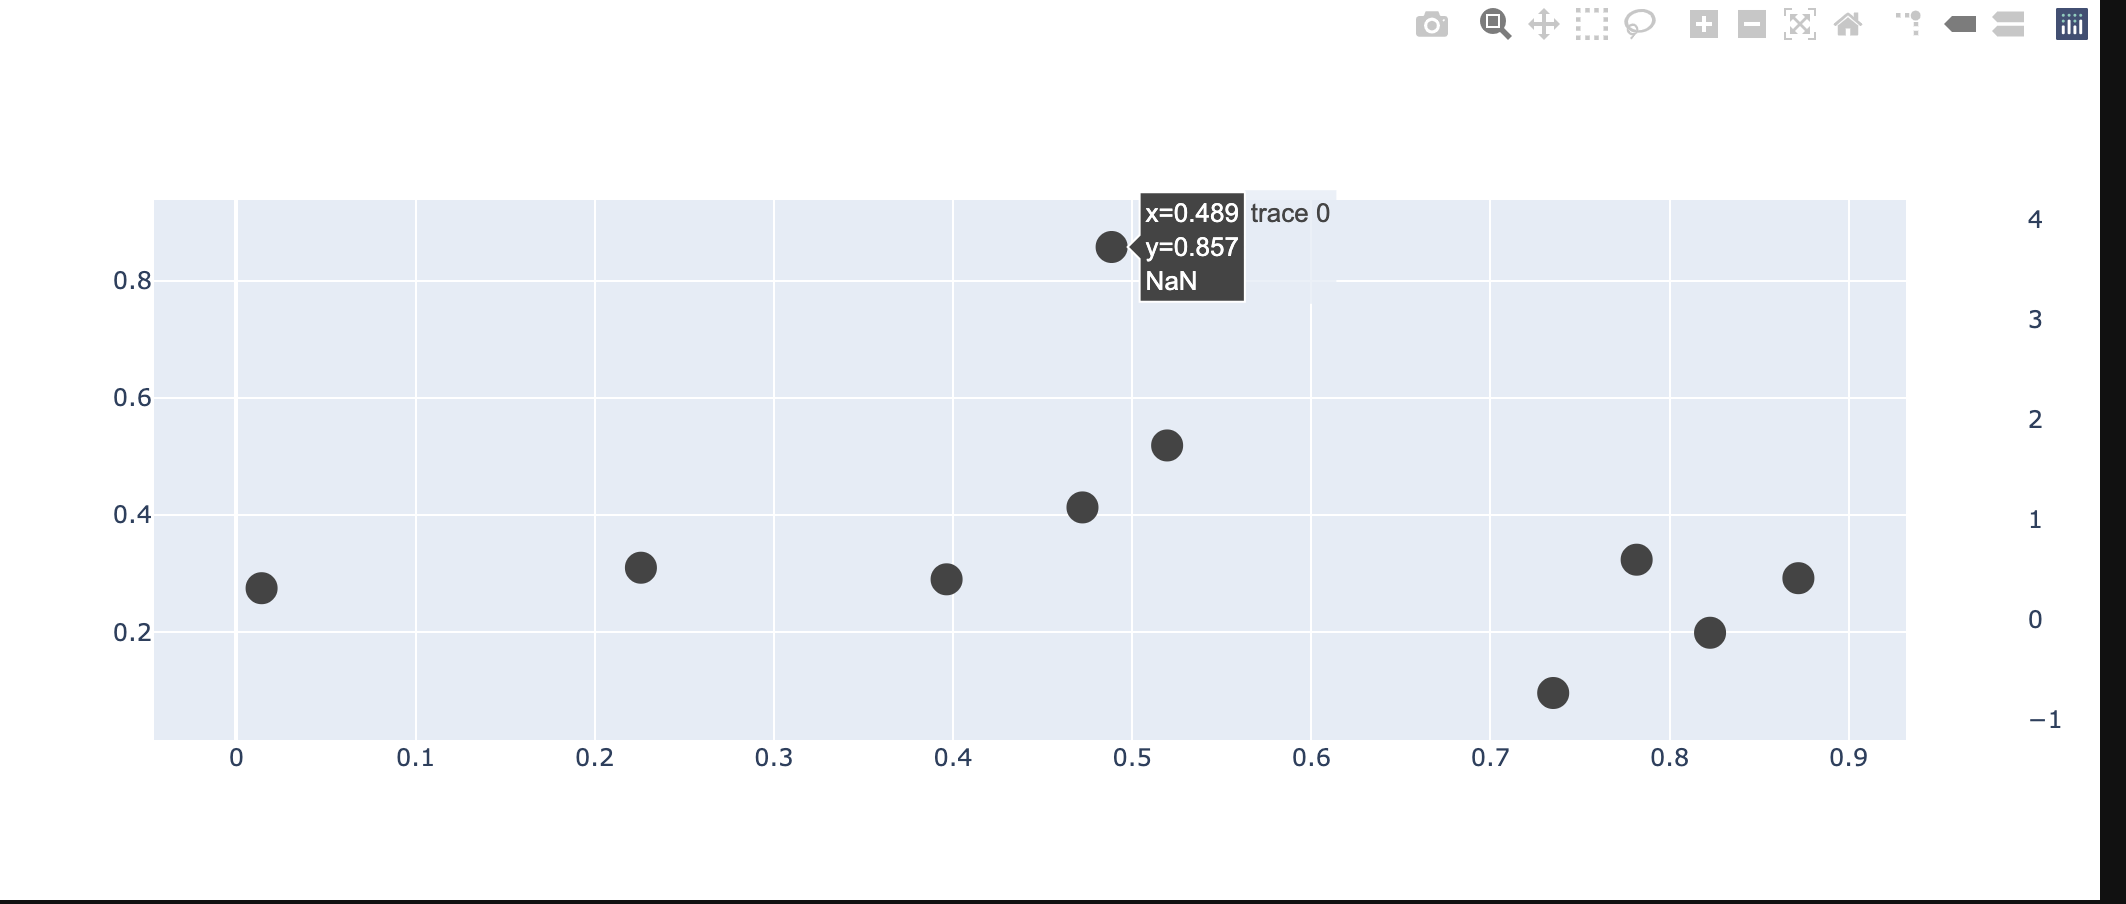
Difference in nans in hover values between figure and figure widget
Nans are labeled as 0.0 when using figure, but correctly as NaN when using FigureWidget.
Minimal reproducible example .
import numpy as np
import plotly.graph_objects as go

x = np.random.random(10)
y = np.random.random(10)
color = np.ones(10)*np.nan

fig = go.Figure(
    data=go.Scatter(
        x=x,
        y=y,
        marker=dict(
            size=16, #set color equal to a variable
            colorscale='Viridis', # one of plotly colorscales
            showscale=True,
            color=color
        ),
        mode='markers',
        hoverinfo="text",
        hovertemplate="x=%{x:.3f}<br>y=%{y:.3f}<br>%{marker.color:.3f}"
    )
)
fig

go.FigureWidget(fig)