Sankey : How to add source labels
Hi,
I am trying to plot a Sankey diagram for the below data:
data = go.Sankey(link = link, node=node,node_pad=20)
print(data)
Sankey({ 'link': {'source': [567, 567, 567, 567, 567, 567, 567, 567, 567, 567, 567, 567, 567, 567, 567, 567], 'target': [0, 1, 2, 3, 4, 5, 6, 7, 8, 9, 10, 11, 12, 13, 14, 15], 'value': [15, 11, 3, 3, 65, 7, 2, 27, 49, 19, 45, 107, 128, 48, 1, 3]}, 'node': {'label': [0, 1, 2, 3, 4, 5, 6, 7, 8, 9, 10, 11, 12, 13, 14, 15, 567], 'pad': 50, 'thickness': 5} })
fig = go.Figure(data)
fig.show()
I am able to get the labels for target node, but not the source node(=567)
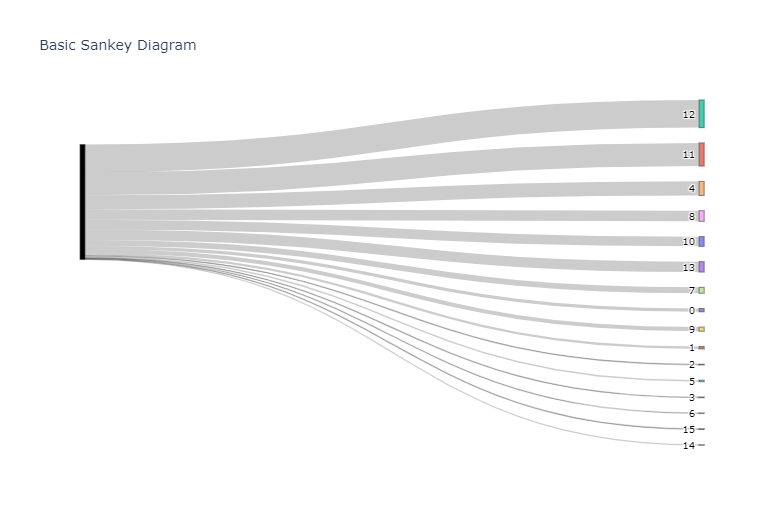
. Is there something I am missing?
567 is not a valid index for the label-list. Instead, the label "567" is found at the 16th position in the label list (label[16] == 567 but label[567] is out of range).
Change your sources to [16, 16, 16, 16, ..., 16] to achieve your desired labels.
(I am not a plotly dev, just came across this issue.)